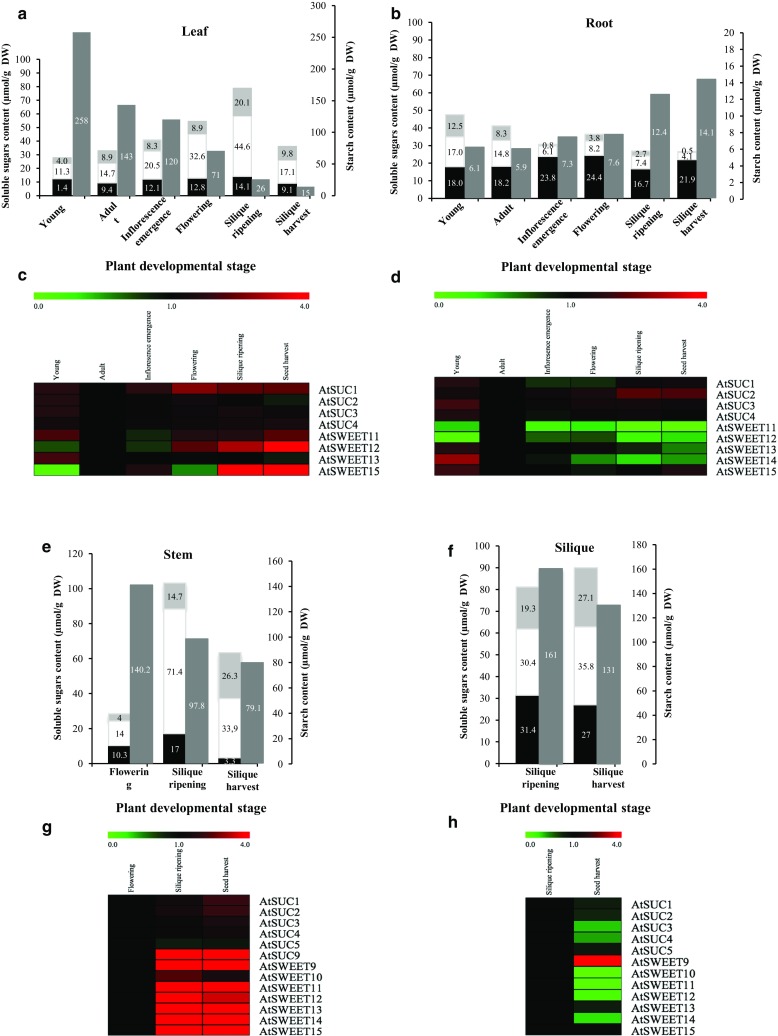
Fig. 5.

Sugar content and fold changes of expression for a set of AtSUC and AtSWEET genes in different organs and at the six principal growth stages of A. thaliana grown hydroponically. Sucrose (black), glucose (white), fructose (light grey), and starch (dark grey) contents measured in leaves (a), roots (b), stems (e), and siliques (f). Data are expressed as the mean ± SE of measures obtained from five plants. Fold change of expressed AtSUC and AtSWEET genes in rosettes (c), roots (d), stems (g), and siliques (h) has been studied. Fold change values are displayed as a two colours heat-map view (MeVsoftware (http://www.tm4.org/mev.html), with rows corresponding to the genes of interest and columns to the six development stages studied with). The oligonucleotides primers used in RT-qPCR experiments are presented in Table S1. Fold change values are obtained by comparison with the adult stage after normalization to the reference gene At5g12240 (Czechowski et al. 2005). Data are the mean of three measures, each corresponding to a pool of five plants
