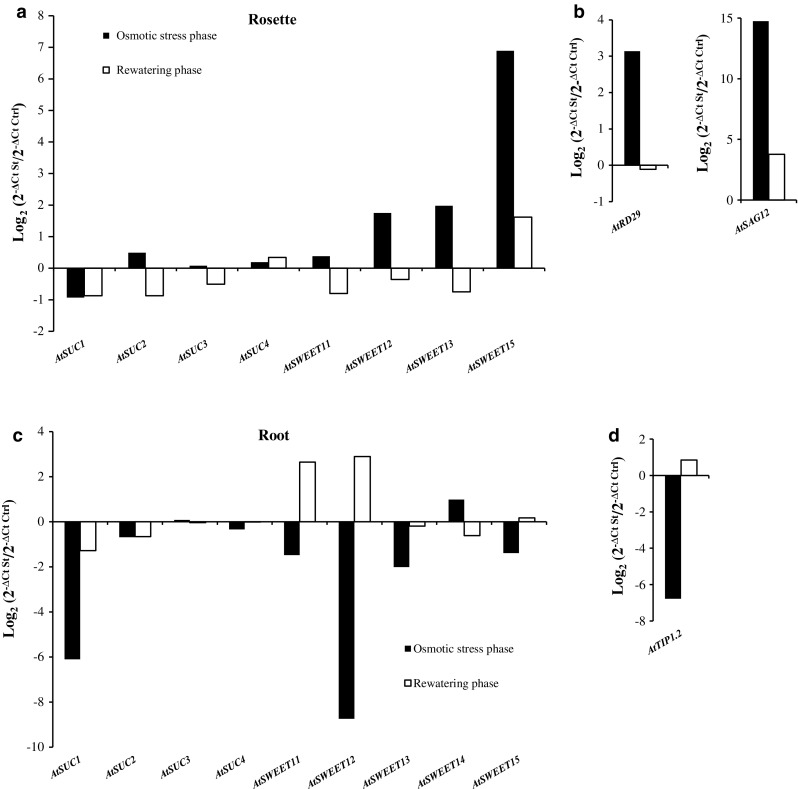
Fig. 8.

Impact of osmotic stress and rewatering on the relative expression (log2 St/C) of a selected set of AtSUC and AtSWEET genes in leaves and roots of plants grown hydroponically. SUC and SWEET transcripts level are quantified by RT-qPCR in rosette (a) and in roots (c) after osmotic stress (black) or rewatering (white). Values in each graph represent the log2 relative expression St/C measured by RT-qPCR using At5g12240 (Czechowski et al. 2005) gene as reference and represent the mean of measures obtained from a pool of five plants The expression of specific genes as osmotic stress markers are followed in the leaf: AtRD29 (b) and in the root: AtTIP1.2 (d) or as senescence-associated gene: AtSAG12 (b) during osmotic stress (black) and during rewatering phase (white)
