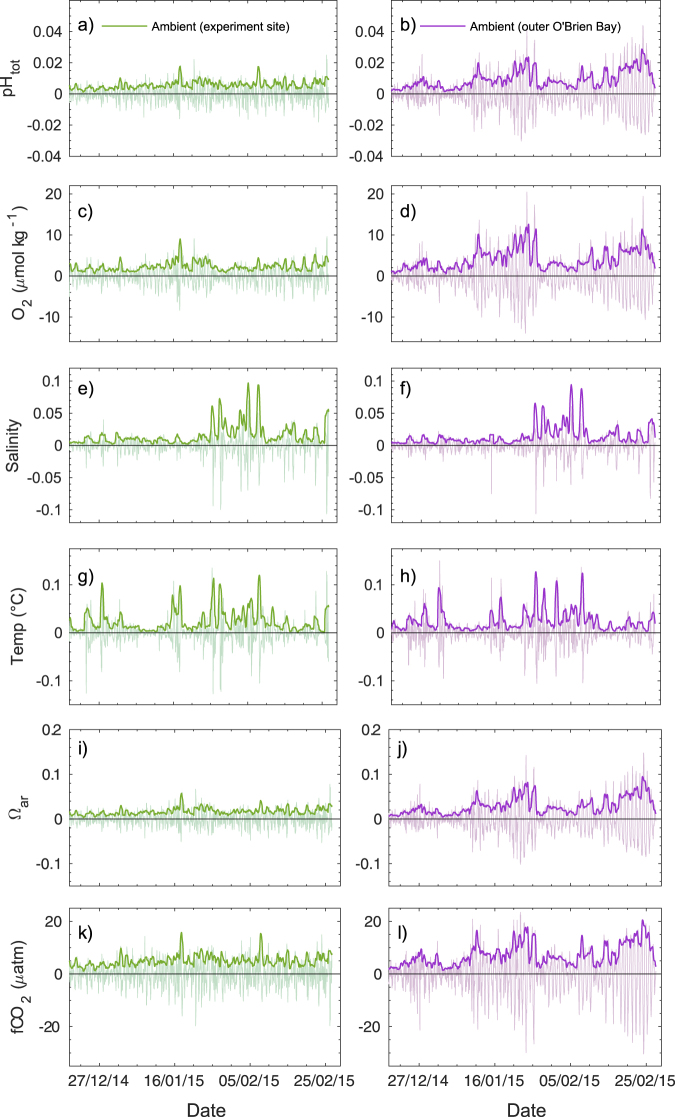
Figure 5.
Short-term variability (diel changes) in ambient seawater conditions at two sites in O’Brien Bay, Casey station Antarctica. High pass filtered data showing: (a) and (b) pHtot; (c) and (d) dissolved oxygen (µmol kg−1); (e) and (f) salinity; (g) and (h) temperature (°C); (i) and (j) aragonite saturation state; (k) and (l) fugacity of CO2. The zero represents a moving 24-hour average value at any given time. Darker coloured lines are the standard deviation of the 24-hour moving average of the high-frequency data (lighter coloured lines).

