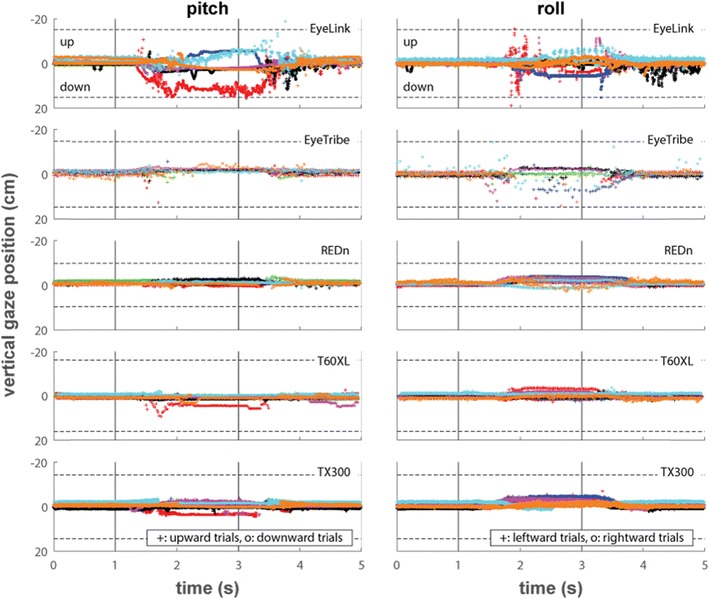
Fig. 8.

Vertical gaze positions over time for the pitch and roll tasks. The horizontal dotted lines indicate the edges of the screen, and the solid vertical lines indicate the beeps that instructed the participants to rotate their head while remaining fixated at 1 s and rotate back at 3 s. The plotted data are the average of the raw data of both eyes over ten trials each for rotating the head to the left or up (plusses) and to the right or down (circles)
