
Fig. 1.
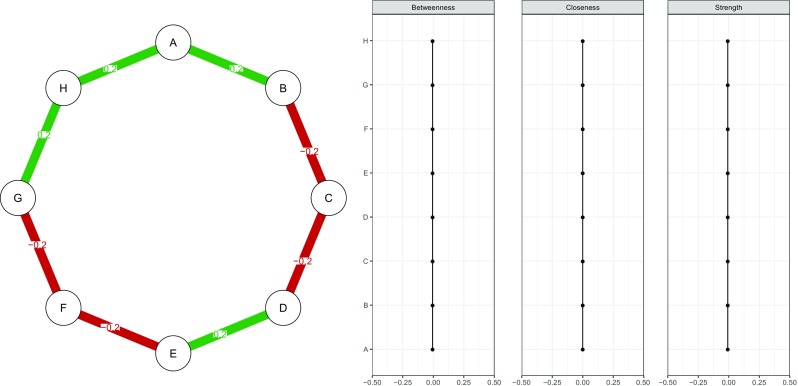
Simulated network structure (left panel) and the importance of each node quantified in centrality indices (right panel). The simulated network is a chain network in which each edge has the same absolute strength. The network model used was a Gaussian graphical model in which each edge represents partial correlation coefficients between two variables after conditioning on all other variables