
Fig. 9.
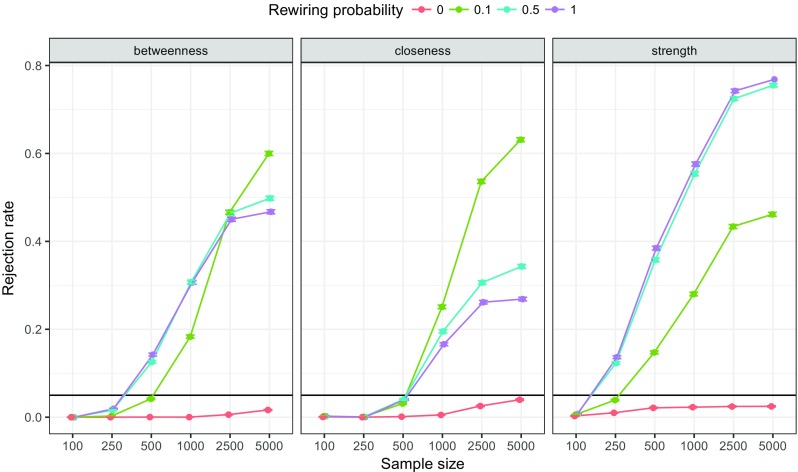
Simulation results showing the rejection rate of the bootstrapped difference test for centrality indices. Datasets were generated using the same design as in Fig. 7. Lines indicate the proportion of times that two random centralities were significantly different (i.e., the null-hypothesis was rejected at α = 0.05)