Fig. 4.

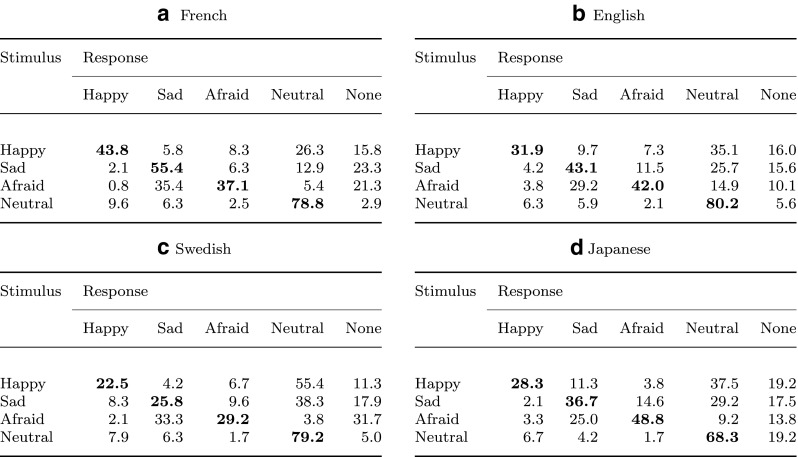
Confusion matrices. French (a), English (b), Swedish (c), and Japanese (d) confusion matrices showing the distribution of responses (in %) at the nominal level. Diagonal cells in bold indicate correct responses

Confusion matrices. French (a), English (b), Swedish (c), and Japanese (d) confusion matrices showing the distribution of responses (in %) at the nominal level. Diagonal cells in bold indicate correct responses