Figure 1.
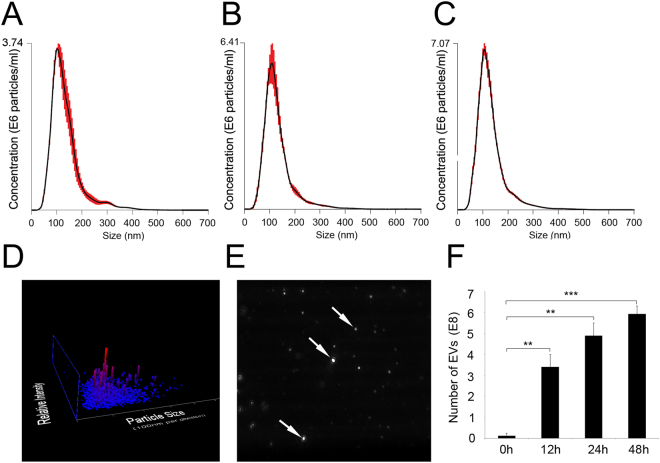
Nanosight analysis of mRPC released extracellular vesicle diameters and concentrations. (A–C) Nanometer diameter ranges and concentrations of mRPC released EVs were analyzed from conditioned media at 12, 24 and 48 h, respectively. Mean diameter for three samples at each time point analyzed were: 12 h = 133+/−3.2 nm, 24 h = 130+/−0.6 nm and 48 h = 132+/−1.8 nm. (D) Sample 3D plot showing EV size/relative intensity at 24 h. (E) Arrows showed light-scattering of individual EVs from a single frame of Nanosight tracking analysis at 24 h. (F) The average concentration of EVs/ml recorded at 0 h = 0.13+/−0.07 E8, 12 h = 3.41+/−0.34 E8, 24 h = 4.91+/−0.35 E8 and 48 h = 5.93+/−0.22 E8.

