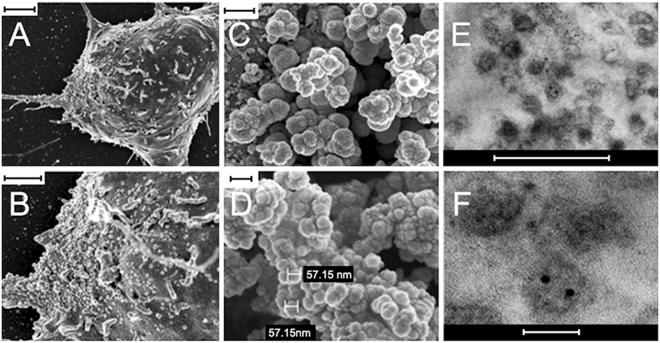
Figure 2.
SEM and TEM characterization of mRPC surface and released extracellular vesicle ultrastructure. (A) SEM analysis of mRPC ultrastructure with extracellular vesicle structures apparent on the soma and left extended process, scale: 2 μm, (B) higher magnification of (A), scale: 1 μm. (C) released EVs isolated from conditioned media using ultracentrifugation appear as clusters under SEM analysis, scale: 300 nm., (D) higher magnification of (C) allows for measurement of two vesicles at 57.15 nm, scale: 100 nm. (E) Immunogold TEM of isolated EV populations reveal the presence of the EV marker CD63, scale: 500 nm, (F) higher magnification of (E), scale: 100 nm.

