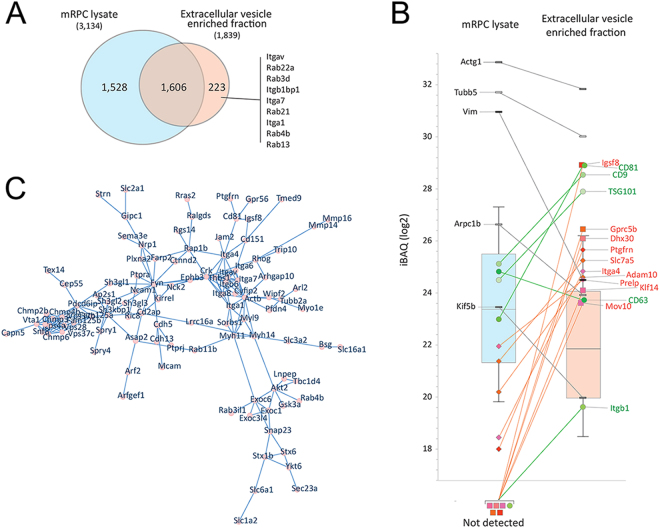
Figure 5.
Qualitative proteomic evaluation of extracellular vesicle enriched fractions from mRPCs. (A) Venn diagram of unique and shared proteins measured in mRPCs (3,134 - blue) and the enriched EV fractions (1,829 - red). Proteins only measured in the EV enriched samples included Rab family proteins. (B) The distribution of iBAQ (intensity Based Absolut Quantitation) values of proteins matched in the two experiments. The measured median iBAQ signal is ~4-fold lower in the EV enriched fraction. Onto the Box Plot are mapped selected proteins belonging to 2 groups: Enriched/unique to EV (green and red) and not-enriched proteins (black/grey). Green indicates proteins often used as EV markers. Red is used for proteins with relevance to mRPC state and development. Squares are used for proteins not identified in the mRPC lysate, while diamonds indicate proteins matched in the mRPC lysate but that are highly enriched in the EV fraction. Black/grey bricks were used to map cellular proteins often observed because of their high abundance. (C) STRING-db (high confidence, 0.700) analysis presented using CytoScape123. A. selected network of proteins enriched 8-fold or more are shown. This network contains integrins, Rab GTP family, SLC transporters family and other vesicle related proteins.

