Figure 6.
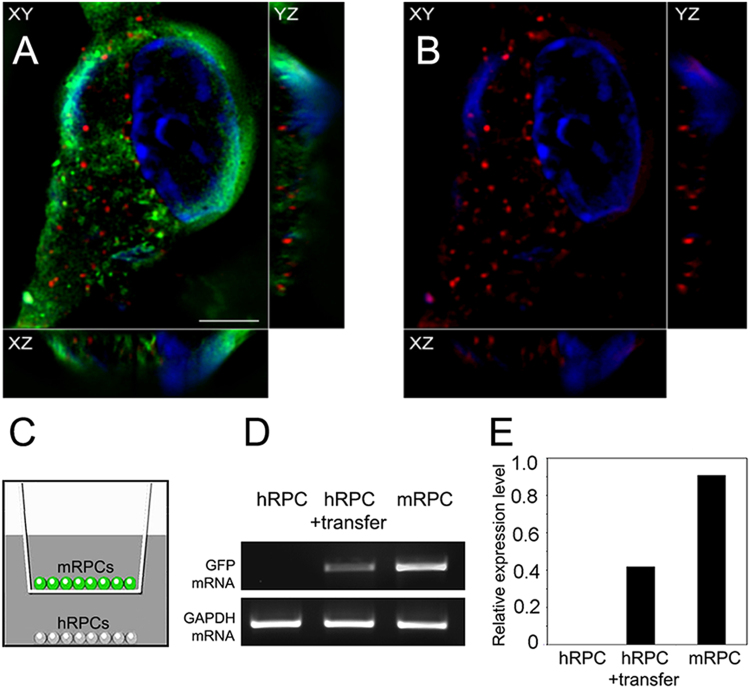
Extracellular vesicle internalization and transfer of GFP mRNA (A) Super resolution 3D reconstruction of GFP+ mRPC following 24 h incubation with PKH26 labeled extracellular vesicles. Red vesicles are visibly localized near the cell surface and within cytoplasm. In the XZ axis, GFP (green), EVs (red) and nuclei (blue, DAPI). (B) same as (A) with GFP (FITC) channel removed to increase visibility of PKH26 (TRITC) labeled EVs. Each panel contains three cross-sectional views (xy, xz, and yz). Scale: 5 µm. (C) RT-PCR analysis of GFP mRNA transfer between GFP+ mRPCs and non-GFP hRPCs. Non-GFP hRPCs served as negative control; GFP+ mRPCs served as postive control. GAPDH served as the internal control gene. EVs were treated using an RNase-Free DNase Set to remove DNA comtamination before cDNA synthesis. (D) Intensities of RT-PCR images were measured with ImageJ software and normalized to GAPDH. Relative levels of hRPC GFP after transfer of EVs is significantly higher than negative control.

