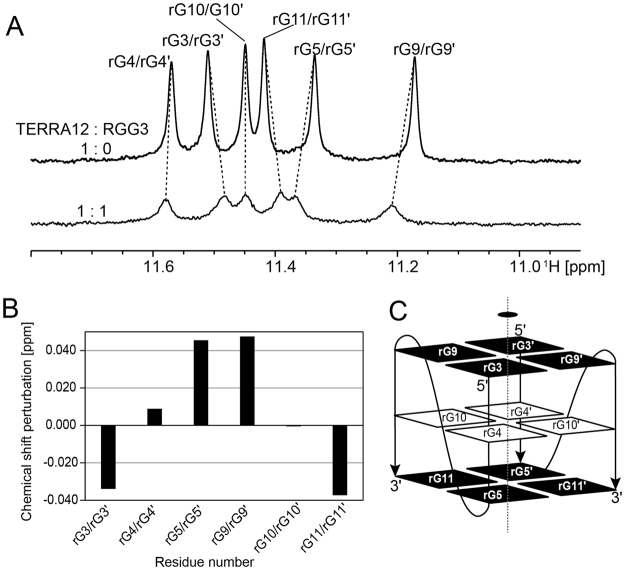
Figure 4.
Chemical shift perturbation analysis of TERRA12 with RGG3. (A) The imino proton regions of TERRA12 either alone (top) or with RGG3 in the ration of 1:1 (lower). Imino proton resonances were assigned according to the previous report4, and are indicated by residue numbers. (B) Chemical shift perturbation of each imino proton resonance of TERRA12 upon addition of an equivalent amount of RGG3. (C) Schematics illustration of TERRA12 G-quadruplex4. The G-quadruplex comprises two monomers. The guanine residues of the second monomer are numbered by prime numbers. The guanine residues that exhibited large chemical shift perturbation are highlighted in black.

