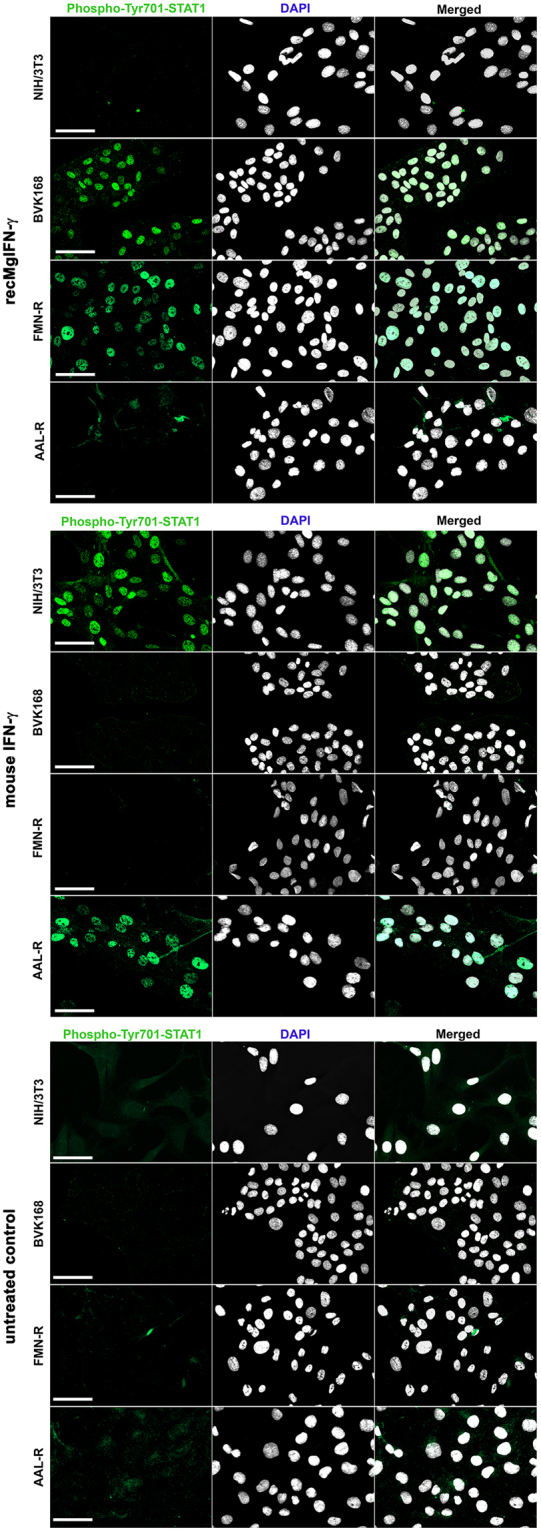
Figure 3.

Species-specific activity of recMgIFN-γ and mouse IFN-γ on different rodent cell lines. NIH/3T3, BVK168, FMN-R and AAL-R cells were tested and either left untreated as control (lower panel), stimulated for 1 h with recMgIFN-γ (200 ng/ml, upper panel) or mouse IFN-γ (200 U/ml, central panel). In each panel the following stainings are shown from left to right: phospho-Tyr701-STAT1 staining (green), DAPI staining (white) and overlay of the two signals. Activated phospho-STAT1 is indicated by nuclear translocation. Of note, minor background signal in the cytoplasma was observed in some control treated cells. A representative experiment of three replicates is shown. The scale bar represents 50 μm.
