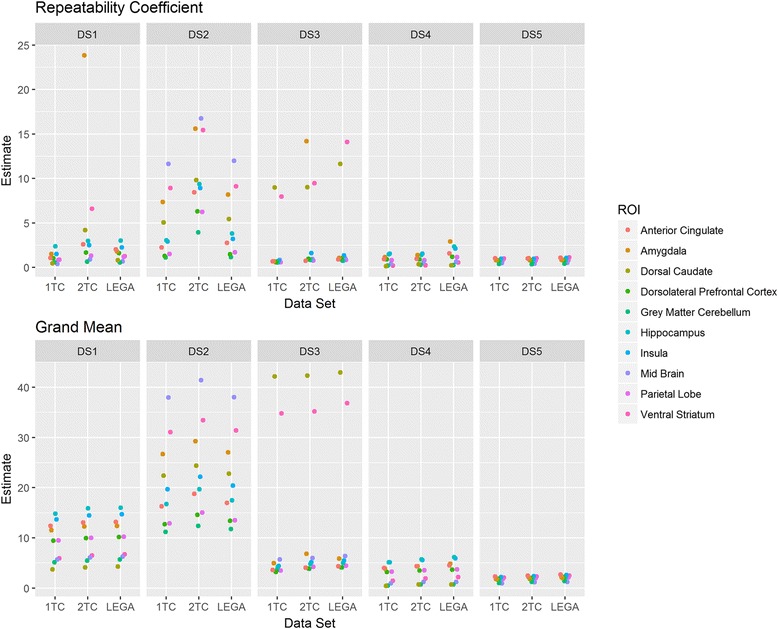
Fig. 3.

Repeatability coefficient (RC) and grand mean across the considered datasets (upper panel and lower panel respectively). Each point in the plot, for a given dataset, represents a particular region of interest (ROI) so that the plot represents the variability of RC across the considered ROIs. For each data set, DS1, DS2, DS3, DS4, and DS5, there were three quantification methods investigated (1, 2, and L denote one-tissue compartment model, two-tissue compartment model, and likelihood estimation in graphical analysis, respectively)
