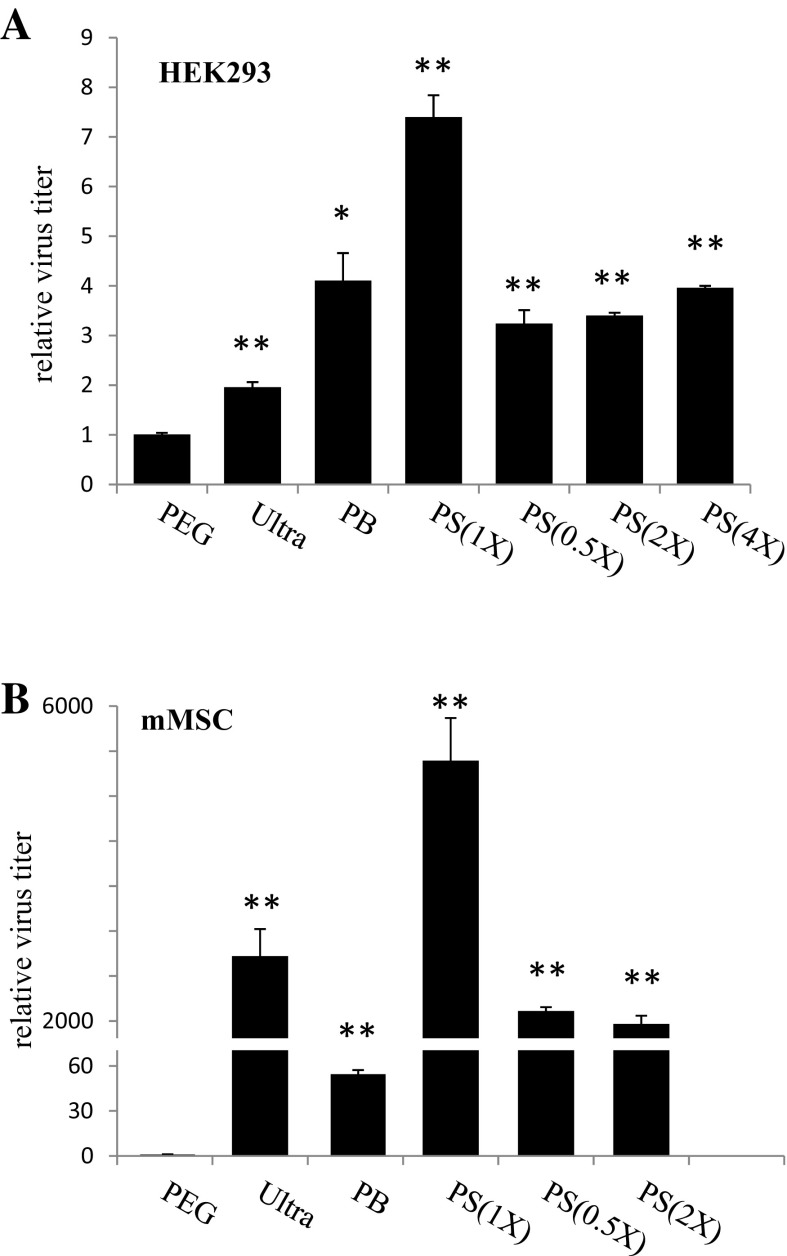
Fig. 3.
A real-time PCR-based analysis was adopted to measure the virus titers after lentivirus transduction to HEK293T cells (a) and mMSC (b). Results indicated that virus purified by PS(1X) produced the highest concentration in both HEK293T cells and mMSC. The relative virus titers were acquired by comparison to the PEG control, which was designated as 1. The Student’s t test was adopted for the statistical analysis. *p < 0.05 and **p < 0.01 were considered significantly different from the PEG controls

