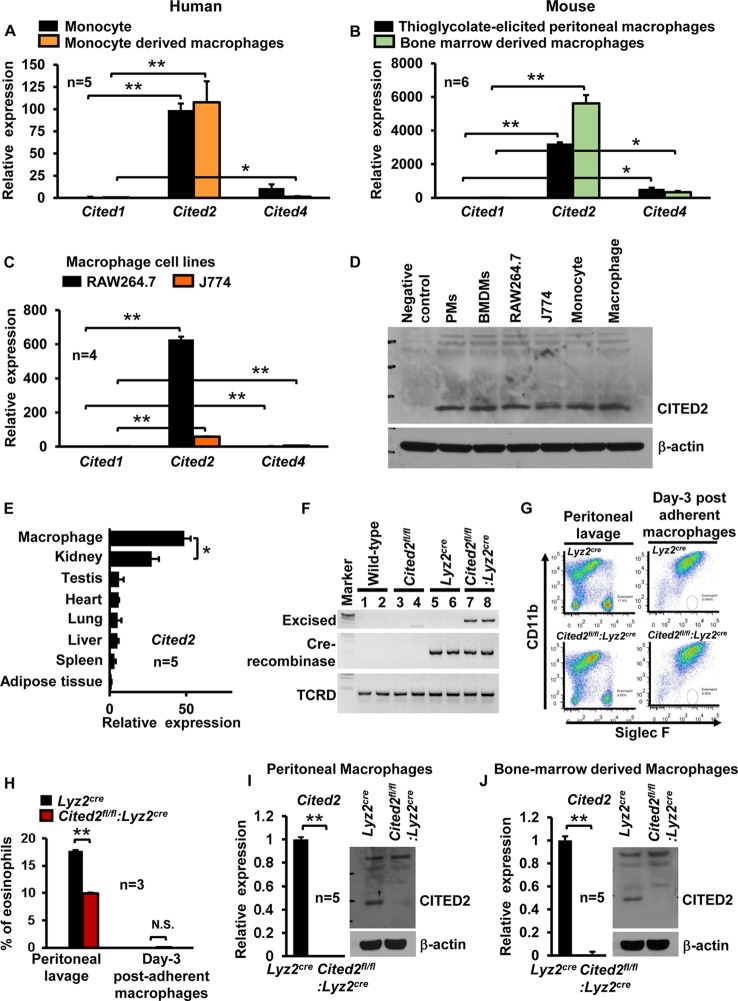
FIG 1.
CITED2 expression in macrophages and effect of myeloid Cited2 deficiency on the adult hematopoietic cell compartment. (A) Human peripheral blood monocytes and monocyte-derived macrophages were analyzed for Cited1, Cited2, and Cited4 mRNA expression by quantitative-PCR analysis. The succinate dehydrogenase complex flavoprotein subunit A (SDHA) gene was used as a housekeeping gene (n = 5). (B) Mouse thioglycolate-elicited peritoneal macrophages and bone marrow-derived macrophages were analyzed for Cited1, Cited2, and Cited4 mRNA expression by quantitative PCR. The 36B4 gene was used as a housekeeping gene (n = 6). (C) Quantitative-PCR analysis of Cited1, Cited2, and Cited4 mRNA expression in RAW 264.7 and J774 cells (n = 4). (D) CITED2 protein expression in indicated primary cells and cell lines by Western blot analysis (n = 3). (E) Cited2 mRNA expression was analyzed in mouse adipose tissue, spleen, liver, lung, heart, testis, kidney, and bone marrow-derived macrophages for relative expression of Cited2 by quantitative-PCR analysis. The 36B4 gene was used as a housekeeping gene (n = 5). (F) Wild-type, Cited2fl/fl, Lyz2cre, and Cited2fl/fl:Lyz2cre BMDM genomic DNA was subjected to reverse transcription-PCR analysis to detect the presence of Cre recombinase and excised Cited2 genomic sequence using a site-specific primer. The T-cell receptor δ chain (TCRD) gene was used as an internal control (n = 3). (G and H) Thioglycolate-elicited peritoneal lavage fluid and postadherent macrophages (day 3) derived from Lyz2cre and Cited2fl/fl:Lyz2cre mice were collected. These cell populations were examined for eosinophil and macrophage abundance by SIGLEC5 (Siglec F) and ITGAM (CD11b) staining and FACS analysis (n = 3). (I and J) Thioglycolate-elicited peritoneal macrophages and BMDMs from Lyz2cre and Cited2fl/fl:Lyz2cre mice were analyzed for CITED2 mRNA and protein expression by quantitative-PCR and Western blot analyses, respectively (n = 5). Data were analyzed by either 2-way ANOVA (A to C) or Student's t test (E to J). N.S., not significant; *, P < 0.01; **, P < 0.0001. All values are reported as means and SD.

