FIG 6.
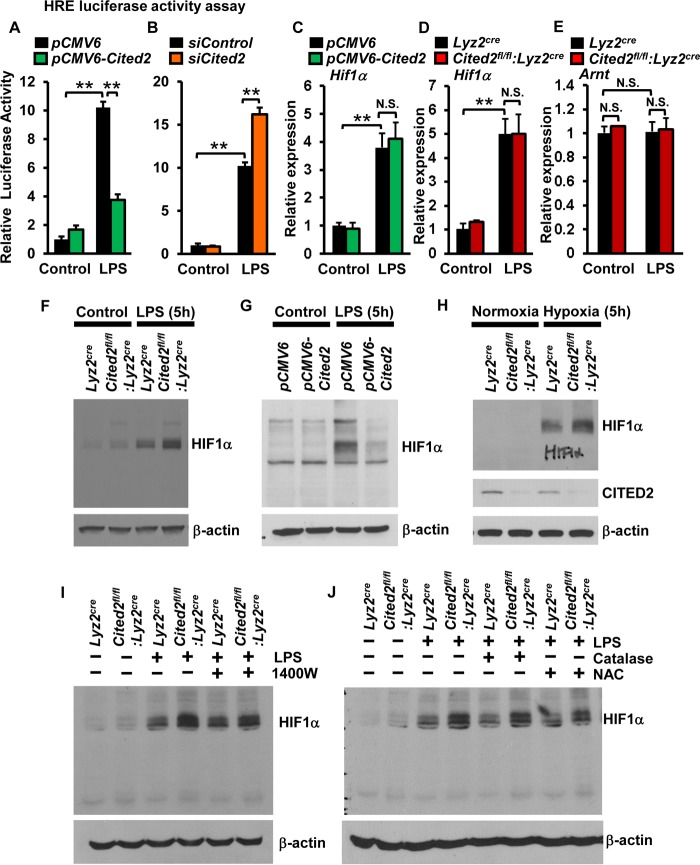
CITED2 suppresses LPS-induced HIF1α protein accumulation. (A and B) RAW 264.7 cells were cotransfected with the HRE-luciferase reporter construct in the presence of pCMV6-Cited2 (A) or siCited2 (B). The cells were stimulated with 100 ng/ml LPS, and the cell lysates were analyzed for luciferase activity (n = 4). (C and D) RAW 264.7 cells transfected with pCMV6 and pCMV6-Cited2 (C) or BMDMs from Lyz2cre and Cited2fl/fl:Lyz2cre mice (D) were induced with 100 ng/ml of LPS for 6 h. Total RNA from the cells was analyzed for Hif1α mRNA expression by quantitative PCR (n = 4). (E) Quantitative-PCR analysis of Arnt expression in Lyz2cre and Cited2fl/fl:Lyz2cre BMDMs (n = 4). (F and G) Primary macrophages from Lyz2cre and Cited2fl/fl:Lyz2cre mice (F) or RAW 264.7 cells transfected with pCMV6 and pCMV6-Cited2 (G) were induced with 100 ng/ml of LPS for 6 h. The cell lysates were analyzed for HIF1α protein expression by immunoblotting (n = 3). (H) Primary macrophages from Lyz2cre and Cited2fl/fl:Lyz2cre mice were exposed to hypoxic condition (1% O2, 5% CO2, 94% N2). The cell lysates were analyzed for HIF1α and CITED2 protein expression by immunoblotting (n = 3). (I and J) Primary macrophages from Lyz2cre and Cited2fl/fl:Lyz2cre mice were exposed to 100 ng/ml LPS in the presence or absence of NOS2 inhibitor (1400W) and reactive oxygen species inhibitor (catalase and N-acetyl cysteine). The cell lysates were analyzed for HIF1α protein expression by immunoblotting (n = 3). The beta-actin and 36B4 genes were used as housekeeping genes for Western blot and quantitative-PCR analyses, respectively. (A to E) Data were analyzed by Student's t test. N.S., not significant; **, P < 0.0001. All values are reported as means and SD.

