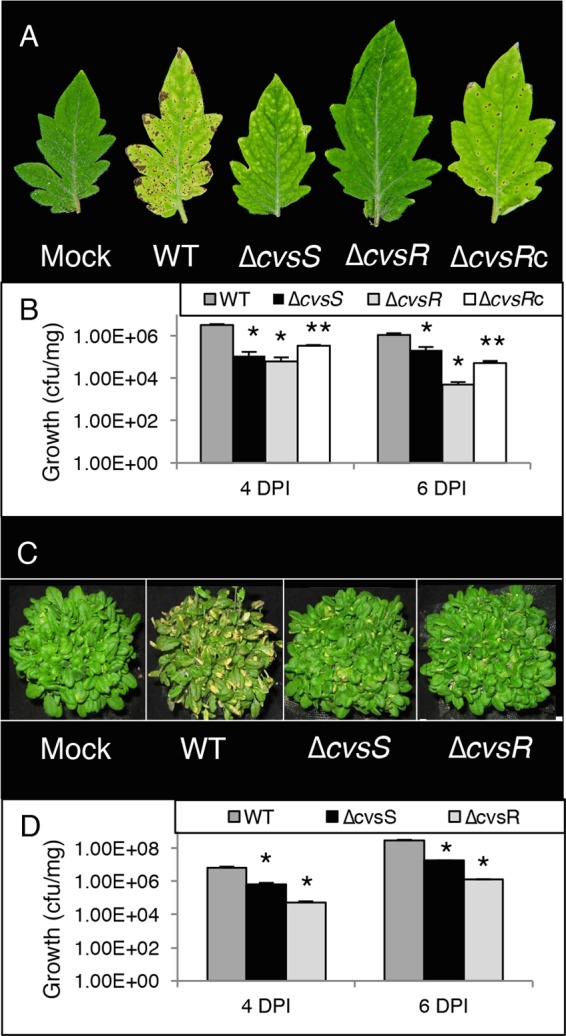
FIG 1.

Growth and symptoms of WT, ΔcvsS, and ΔcvsR strains on tomato and A. thaliana. (A) Image of symptoms at 6 dpi of tomato dip inoculated with P. syringae pv. tomato DC3000 strains. (B) Growth (CFU/mg) at 4 dpi and 6 dpi for the WT, ΔcvsS, ΔcvsR, and ΔcvsRc strains infecting tomato. The strains were inoculated at 2 × 10⁷ CFU/ml. Average bacterial growth in three plants is shown, with the error bars representing the standard error between the three replicates. (C) Image of symptoms at 4 dpi on A. thaliana vacuum infiltrated with P. syringae pv. tomato DC3000 strains. (D) Growth (CFU/mg) at 4 dpi and 6 dpi for the WT, ΔcvsS, and ΔcvsR strains infecting A. thaliana that had been inoculated at 3 × 10⁴ CFU/ml. Average bacterial growth in three plants is shown, with the error bars representing the standard error between the three replicates. In panels B and D, * denotes a statistically significant difference with a P value of <0.01 between growth of the WT and ΔcvsS and ΔcvsR strains and ** denotes a statistically significant difference with a P value of <0.01 between the ΔcvsR and ΔcvsRc strains, determined using Student's two-tailed t test.
