. 2017 Jul 4;71(1):48–56. doi: 10.4097/kjae.2018.71.1.48

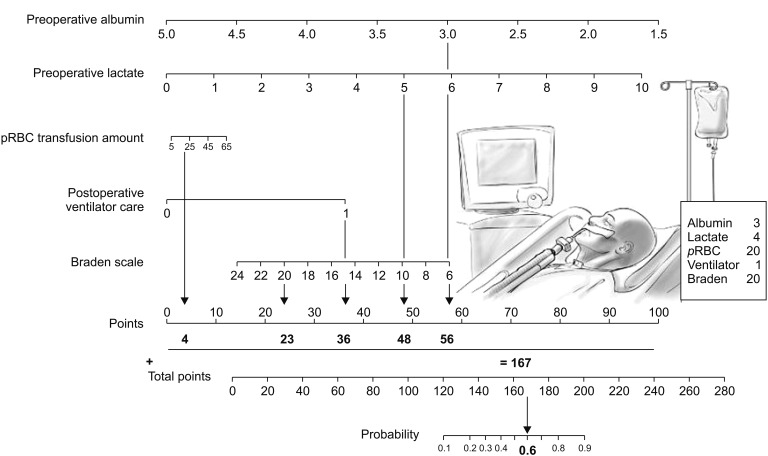
Fig. 3. Nomogram to predict the probability of postoperative pressure ulcer (Top). Points are obtained according to the prognostic contribution of parameters (Bottom). Points are translated to the probability of requiring postoperative pressure ulcer. Predictor points are found on the uppermost point scale that corresponds to each individual variable. The reader then manually sums the points, and the predicted values can be read at the bottom of the nomogram. The total projected on the bottom scale indicates the probability of postoperative pressure ulcer. For example, a patient is admitted to the ICU after major surgery. Preoperative laboratory data shows that albumin is 3.0 g/dl and lactate is 4.0 mmol/L. During the surgery, 20 units of packed RBC units are transfused. Postoperatively, he is transferred to ICU and needed a mechanical ventilator support for a while. At that time, Braden scale assessed by a nurse is 20. In this case, the incidence of postoperative pressure ulcer is expected as much as 60% by using this nomogram. Therefore, clinician and nursing practioners should be more concerned to prevent pressure ulcer for this patient.

Fig. 3