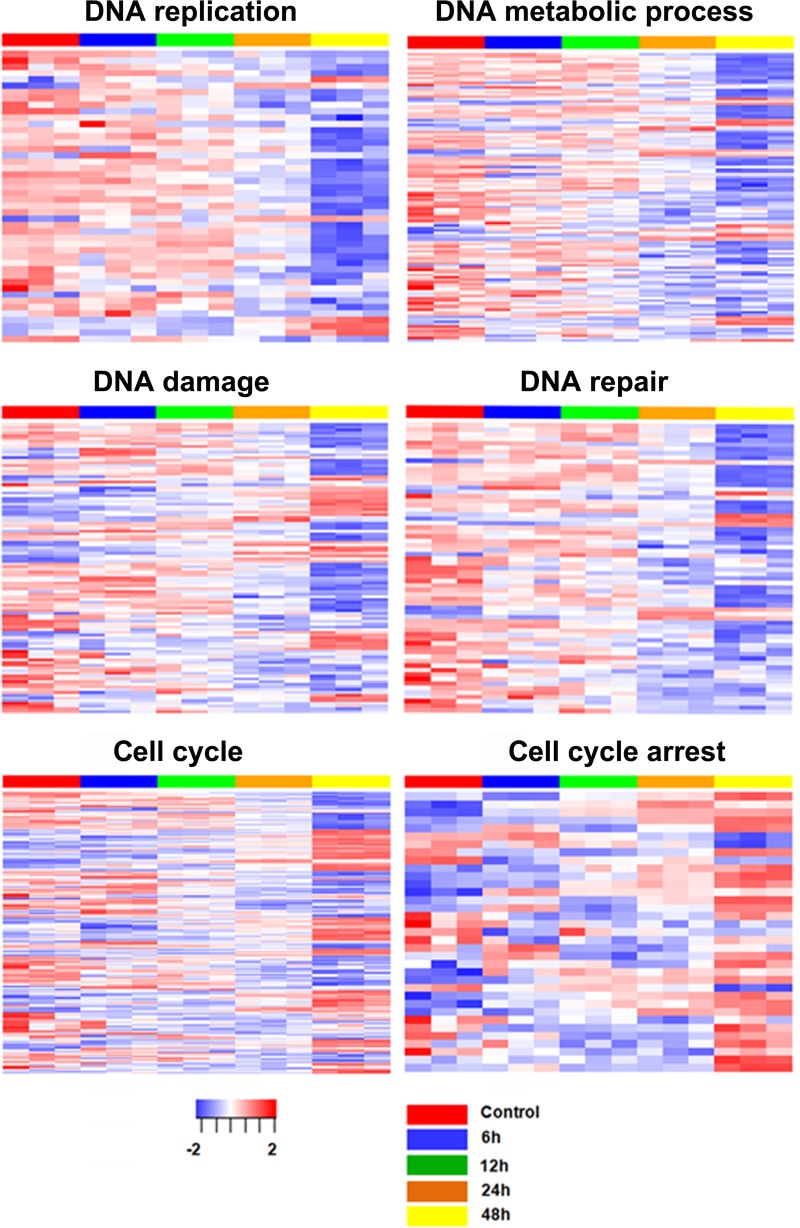
FIG 2.
Heat maps of the differentially expressed genes associated with DNA replication, DNA metabolic process, DNA damage, DNA repair, cell cycle, and cell cycle arrest pathways. Each column represents gene expression data from microarray analyses of CD36+ EPCs infected with B19V at different time points (n = 3 for each). Each row represents a gene. Red indicates increased expression, and blue indicates decreased expression.

