FIG 3.
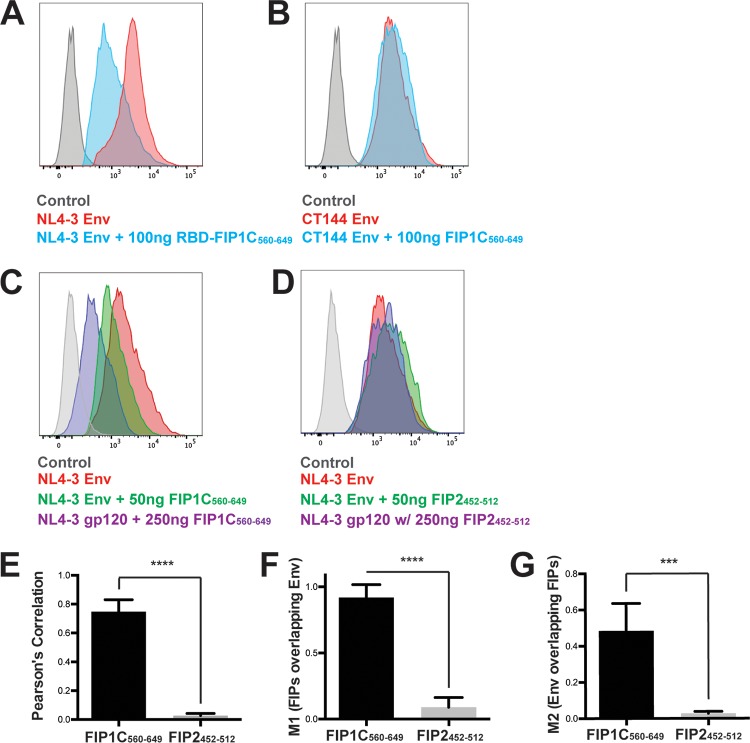
Cell surface levels of CT144 Env and effect of FIP1C560–649 versus FIP2452–512. (A) HeLa cells were cotransfected with GFP-FIP1C560–649 and pNL4-3 proviral plasmid and stained for Env using anti-gp120 mouse monoclonal antibody BDI123. Histograms of cell surface staining are shown in the absence (red) or presence (other colors as indicated) of FIP1C560-649 expression. (B) CT144 proviral plasmid was substituted for wild-type Env and cell surface staining repeated with and without GFP-FIP1C560–649. (C) Dose titration of GFP-FIP1C560–649 resulted in dose-dependent reduction in cell surface Env signal. (D) Dose titration of GFP-FIP2452–512 had little effect on cell surface Env. (E) The degree of colocalization between GFP-FIPs and HIV-1 Env was measured by Pearson's correlation coefficient equation using Volocity 6.3 software after manual thresholding. Results are shown as means ± SD from a total of 10 representative images. ***, P < 0.001; ****, P < 0.0001. P values were calculated using the Student's unpaired t test using GraphPad Prism 6. (F and G) Correlation coefficients, FIP1C signal/Env (M1), or Env signal/FIP1C (M2) from the images examined for panel E.

