FIG 9.
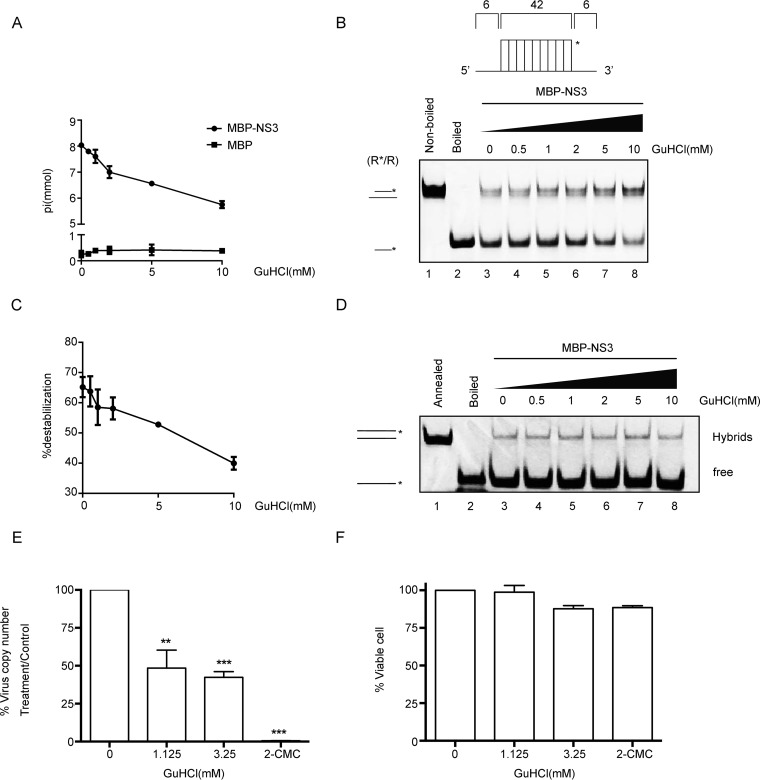
GuHCl inhibits the biochemical activities of NV NS3. (A) The NTPase activity of MBP-NS3 was measured as nanomoles of released inorganic phosphate in the presence of the indicated concentrations (0 to 10 mM) of GuHCl. MBP alone was used as the negative control. (B) The standard RNA helix (R*/R) substrate is illustrated in the upper diagram. R*/R substrate (0.1 pmol) was reacted with 20 pmol MBP-NS3 in the presence of the indicated concentrations (0 to 10 mM) of GuHCl. Native (lane 1) or boiled (lane 2) reaction mixture was used as a negative or positive control, respectively. Helix unwinding was detected by gel electrophoresis and scanning on a Typhoon 9500 imager. The asterisk indicates the HEX-labeled strand. (C) The unwinding activities under different GuHCl concentrations were plotted as percentages of the released RNA from the total RNA helix substrate (y axis) at each indicated GuHCl concentration (x axis) with Bio-Rad Quantity One software. The error bars represent standard deviation values from the results of three separate experiments. (D) The two strands shown in Fig. 7B were mixed 1:1 (0.1 pmol each) and reacted with 10 pmol MBP-NS3 for 30 min in the presence of different concentrations of GuHCl in the absence of NTP. The hybridization of the two strands was detected by gel electrophoresis and scanning on a Typhoon 9500 imager. The preannealed (lane 1) or boiled (lane 2) reaction mixture was used as a positive or negative control, respectively. The hybridized and free strands are indicated. (E) The effect of GuHCl or 2CMC on Norwalk virus RNA levels was determined by examining the impact on NV replicon RNA levels in HGT-NV cells following 3 days of treatment. HGT-NV cells were treated with the indicated levels of either GuHCl or 2CMC, and the levels of viral RNA were calculated as a percentage of the mock-treated control. *, P < 0.05; **, P < 0.01; ***, P < 0.001. (F) HGT-NV cells were treated as for panel D, and the number of viable cells was determined. The cell viability was calculated as a percentage of that of the mock-treated control. The error bars represent SD (n = 3). Statistical significance was determined using an unpaired t test. The experiment was repeated at least two independent times, with one representative data set presented.

