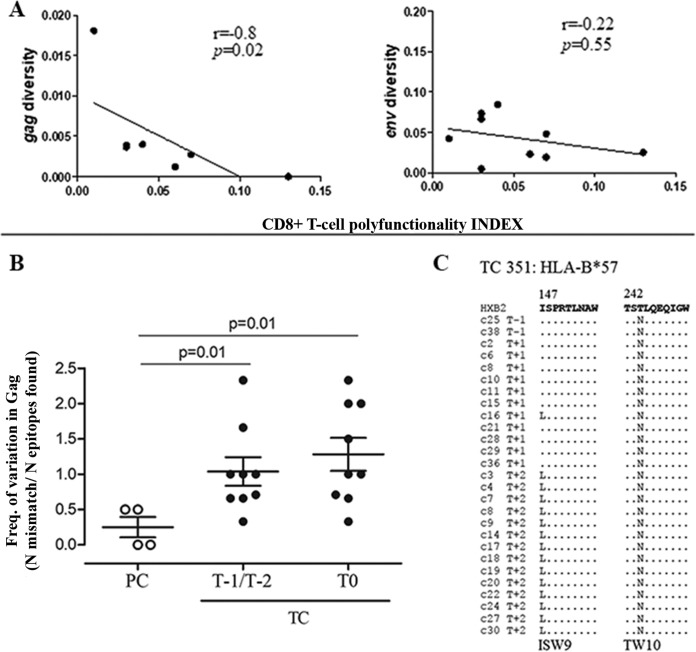
FIG 7.
Correlation of virus diversity with CD8+ T-cell polyfunctionality and analysis of Gag CD8+ T-cell epitope variation. (A) Correlations between gag and env diversity and the total CD8+ T-cell three-cytokine polyfunctionality index (pINDEX for three functions) in TC are shown. The Spearman rho correlation coefficient test was used. (B) Analysis of HIV-1 Gag CD8+ T-cell epitope variation. The frequencies (Freq.) of variation in HIV-1 Gag CD8+ T-cell epitopes in PC and TC before and after the loss of virological control are shown. Differences between groups were determined by the Mann-Whitney U test. (C) HIV-1 sequence variation in Gag ISW9 and TW10 epitopes restricted by HLA-B*57 in TC 351 during the follow-up.

