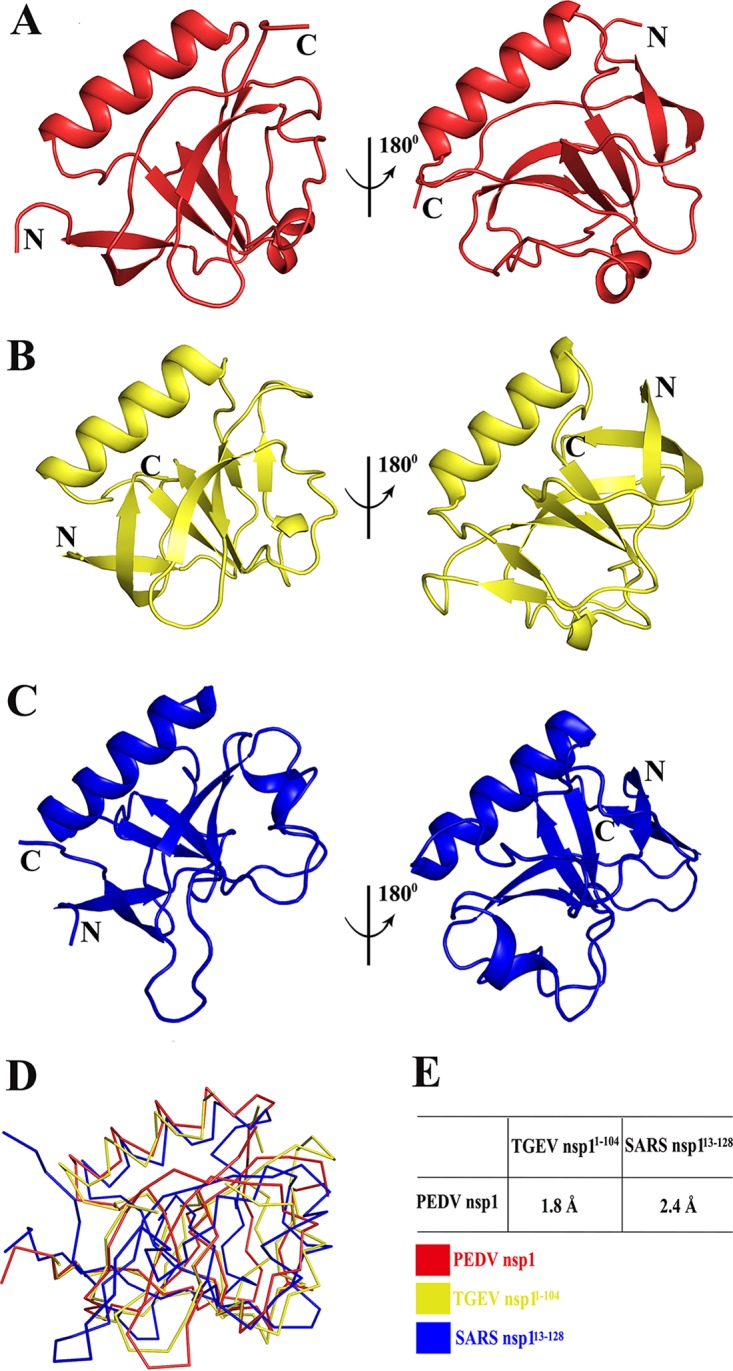
FIG 3.

Structural comparisons of PEDV nsp1, SARS-CoV nsp113–128 (PDB accession number 2GDT) (blue), and TGEV nsp11–104 (PDB accession number 3ZBD) (red). (A) Overlay of PEDV nsp1 at 180 degrees. (B) Overlay of TGEV nsp11–104 at 180 degrees. (C) Overlay of SARS-CoV nsp113–128 at 180 degrees. PEDV nsp1 is shown in yellow, TGEV nsp11–104 is shown in red, and SARS-CoV nsp113–128 is shown in blue. (D) Ribbon diagrams for the three structures. (E) Sequence identities and RMSDs between PEDV nsp1 and TGEV nsp11–104 or between PEDV nsp1 and SARS-CoV nsp113–128. RMSDs were calculated using COOT.
