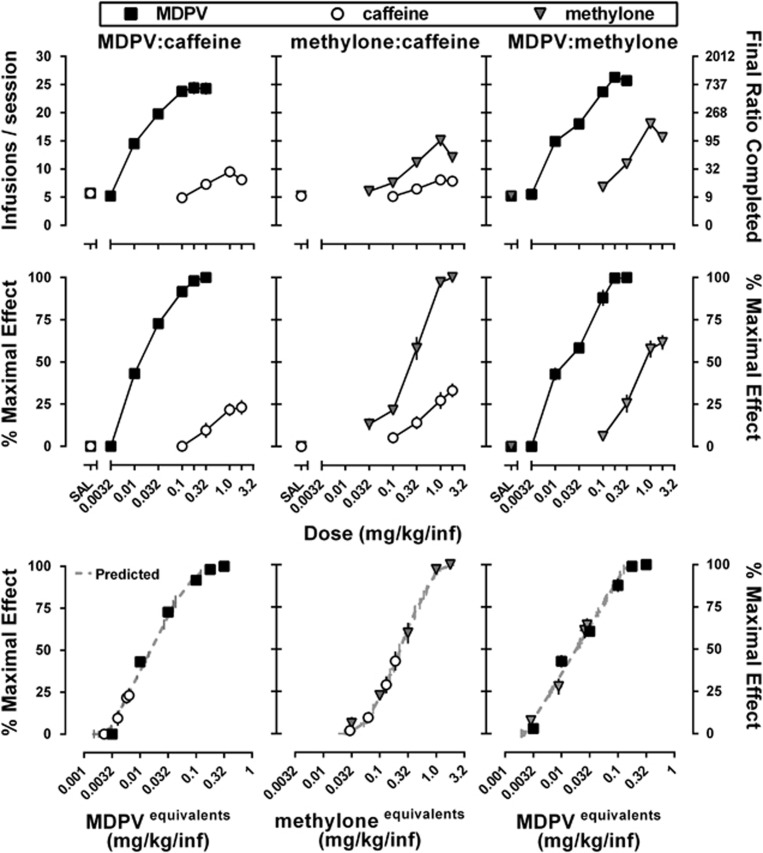
Figure 1.
Dose–response curves for the self-administration of MDPV (squares), caffeine (circles), and methylone (triangles) under a progressive ratio schedule of reinforcement (n=12 per group). Abscissa: first and second rows—‘SAL’ represents data obtained when saline was available for infusion, whereas doses refer to the unit dose of each drug available for infusion expressed as mg/kg/inf on a log scale. Third row—doses refer to the MDPV (first and third columns) or methylone (middle column) equivalents available for infusion expressed as mg/kg/inf on a log scale. Ordinate: first row—total infusions±SEM obtained during the session. Second and third rows—percent of the maximal effect±SEM, normalized to the drug in each pair that maintained the most responding (100%) and saline (0%).

