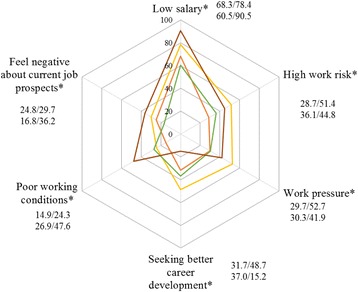
Fig. 4.

Reason to quit current job by location areas. Orange: metropolitan area (%). Yellow: newly developed urban area (%). Green: ecological conservation area (%). Brown: environment protection area (%). Note: (1) * means p < 0.05, indicating that the results of χ2 test showed statistical significance; (2) the number near to each reason represent percentage for metropolitan area, newly developed urban area, ecological conservation area and environment protection area respectively
