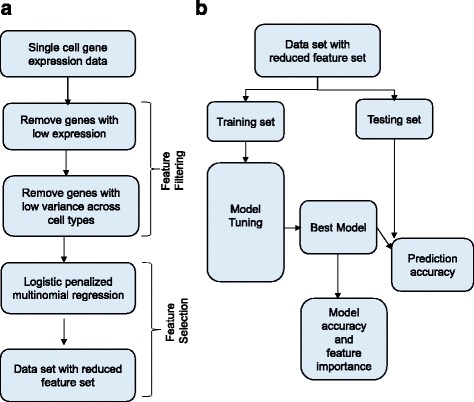
Fig. 1.

The predictive analysis pipeline. a Panel (a) show the steps involved in removing the number of genes excluded from the set of predictors for breast cancer cell type. b Panel (b) shows the basic model tuning process. The data is split into training and testing sets. Models are tuned using the training set. Optimal model is used for prediction in the testing set
