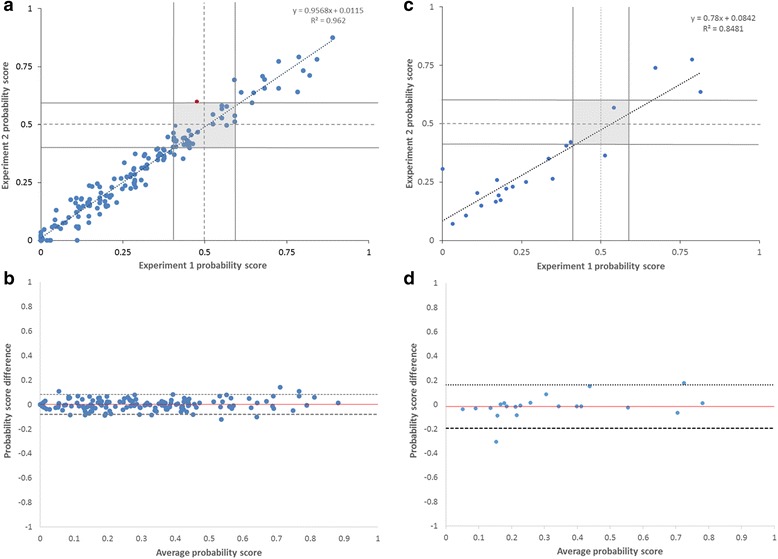
Fig. 4.

Results from concordance studies on probability score values of the DecisionDx-Melanoma test. a Inter-assay correlation analysis for 168 cases; b Bland-Altman plot for 168 cases showing estimated bias (mean difference in probability scores, red line) and 95% confidence interval (dashed lines); c instrument-to-instrument correlation analysis for 21 cases; d Bland-Altman plot for 21 cases showing estimated bias (mean difference in probability scores, red line) and 95% confidence interval (dashed lines)
