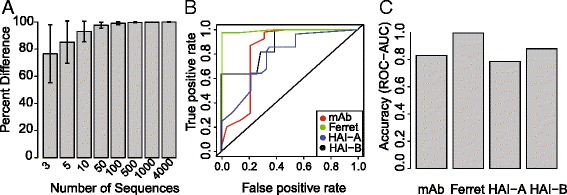
Fig. 4.

Precision and Accuracy. a Precision of the distances between antigens on the map was determined using random sampling of HA sequences (0–4000 sequences) to construct the map. Each sampling was performed 50 times. Precision is given as the mean percent difference between distances of randomly chosen sequences and distances in original map. Error bars represent the standard deviation between results of sequence samplings. b ROC-AUC measurements of accuracy for each of assay type and criteria, HAI-A and HAI B represent 2-fold and 1:40-dilution criteria, respectively. c ROC curves over the range of antigenic distances cutoffs
