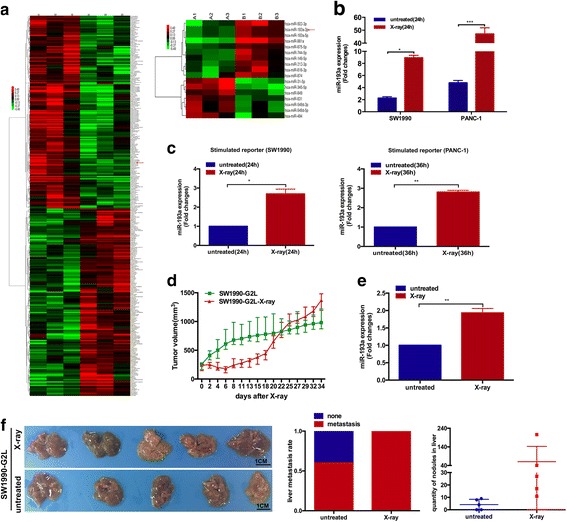
Fig. 1.

miR-193a from the irradiated cells promotes cancer repopulation and metastasis. a Heatmap of mRNA (Left) and miRNA (Right) profiles in the untreated (A1-A3) and the irradiated (B1-B3) cancer cells. b & c RT-qPCR for detecting miR-193a expression changes in pancreatic cells (±X-ray), and in the stimulated SW1990 and PANC-1 reporter cells co-cultured with their corresponding feeder cells (±X-ray). ***p < 0.001, **p < 0.01, *p < 0.05. n = 3. d Tumor growth curve of pancreatic cancer (burdened with 5 × 10⁶ SW1990-G2L cells) on X-ray radiation. n = 5. (E) RT-qPCR for assessing miR-193a expression changes in mice (±X-ray) with pancreatic tumors. **p < 0.01. (F) Liver metastasis of tumor-bearing mice (±X-ray) with SW1990-G2L cells. Left, photograph of the dissected liver, n = 5. Scale bar, 1 cm. Central, liver metastasis rate. Right, numbers of liver nodules
