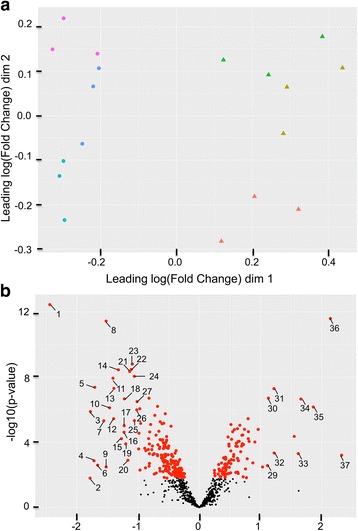
Fig. 1.

Multidimensional scaling (MDS) (A) and volcano plot (B) of the liver proteome profile of Atlantic salmon held at 15 °C and 21 °C. a Data points in the MDS are plotted with symbols (•: 15 °C; ▲: 21 °C), representing temperature treatments, and colors, representing tank allocation. b Red dots in the volcano plot represent proteins to be significantly different (adjusted p-value < 0.05). Numbered dots refer to proteins displaying fold changes > 2 as described in Table 2
