Fig. 3.

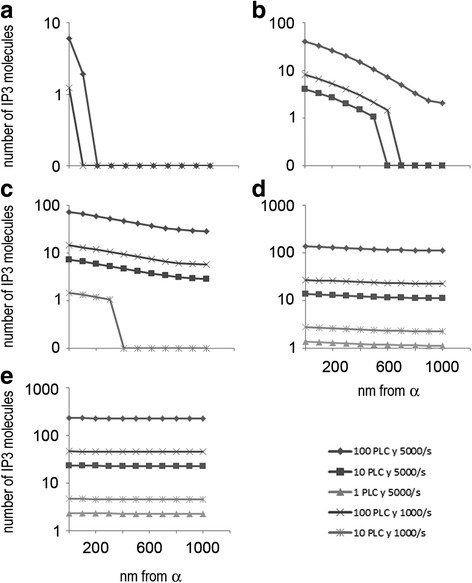
Approximate number of IP3 molecules along the PAPm for different PLC conditions and times, according to the concentration profiles depicted in Fig. 2. a 16 μs; b 333 μs; c 1 ms; d 2.6 ms; e 5 ms

Approximate number of IP3 molecules along the PAPm for different PLC conditions and times, according to the concentration profiles depicted in Fig. 2. a 16 μs; b 333 μs; c 1 ms; d 2.6 ms; e 5 ms