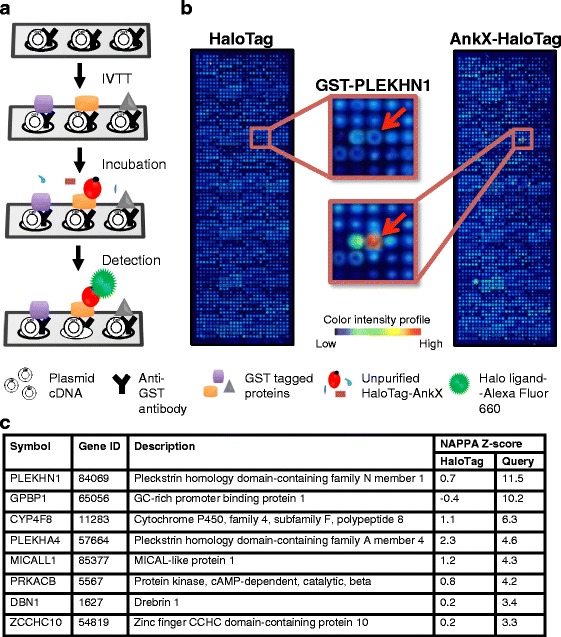
Fig. 1.

Identification of AnkX host targets by a NAPPA interaction assay. a Schematic illustration of the NAPPA-based protein-protein interaction screen. b NAPPA protein microarray after probing with HaloTag (control; left) or AnkX-HaloTag (right). Blue indicates no/low signal intensity, while red indicates maximal signal intensity. Inset shows a magnified view of the NAPPA regions containing the GST-PLEKHN1 spots (arrows) illuminated after incubation with the Alexa Fluor 660-conjugated HaloTag ligand. c List of AnkX host target candidates identified by NAPPA with a Z-score above 3
