Figure 3.
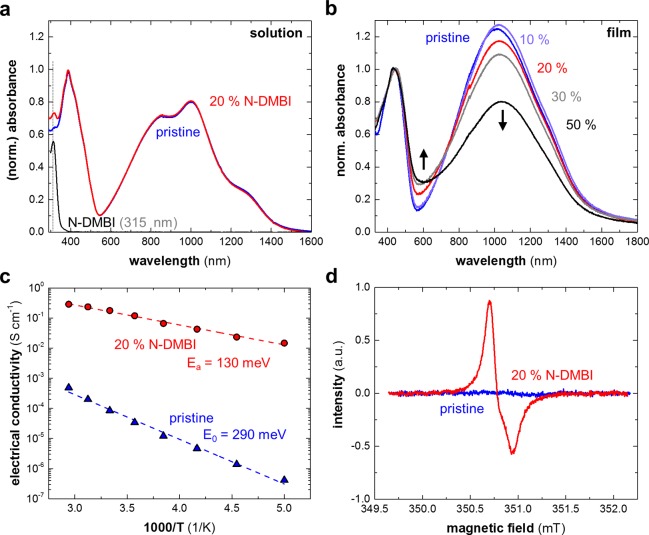
(a) Solution absorbance spectra of pristine p(gNDI-gT2), p(gNDI-gT2) + 20 mol % N-DMBI (note that the spectral feature at 315 nm is due to neat N-DMBI), and neat N-DMBI in chloroform; (b) normalized absorbance spectra of pristine and N-DMBI-doped p(gNDI-gT2) films (10, 20, 30, and 50 mol % N-DMBI); (c) Arrhenius plots of variable-temperature conductivity measurements (dashed lines are fits to the Arrhenius equation, yielding the activation energies E0 and Ea); and (d) electron paramagnetic resonance (EPR) spectra of pristine and N-DMBI-doped p(gNDI-gT2) films.

