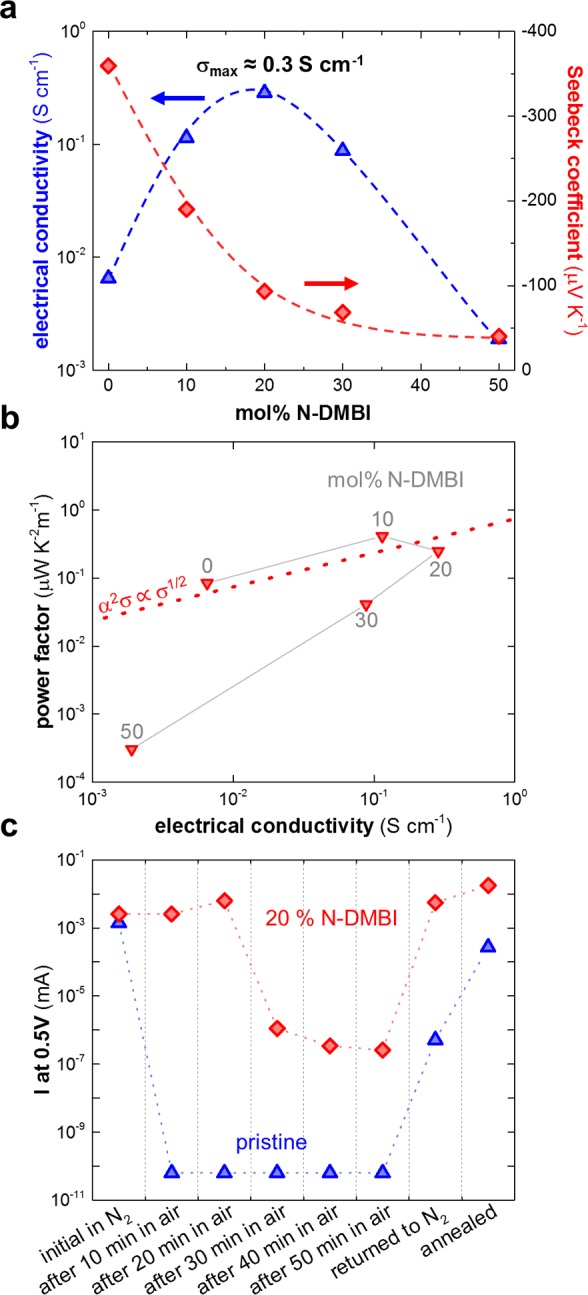
Figure 5.

(a) Electrical conductivity (σ) and Seebeck coefficient (α); dashed lines are a guide to the eye. (b) Thermoelectric power factor (α2σ) as a function of the electrical conductivity at various dopant fractions; the dashed line represents the empirical relation α2σ ∝ σ1/2.10 (c) Air stability of pristine and N-DMBI-doped p(gNDI-gT2): the current at 0.5 V was extracted from I–V curves recorded in nitrogen, in air, and finally again in nitrogen; note that the nonohmic behavior of several samples prevented us from extracting the electrical conductivity. A contact geometry with a channel length of 1000 μm and a channel width of 30 μm was used for air stability measurements of doped samples, which resulted in similar currents for the pristine and doped sample.
