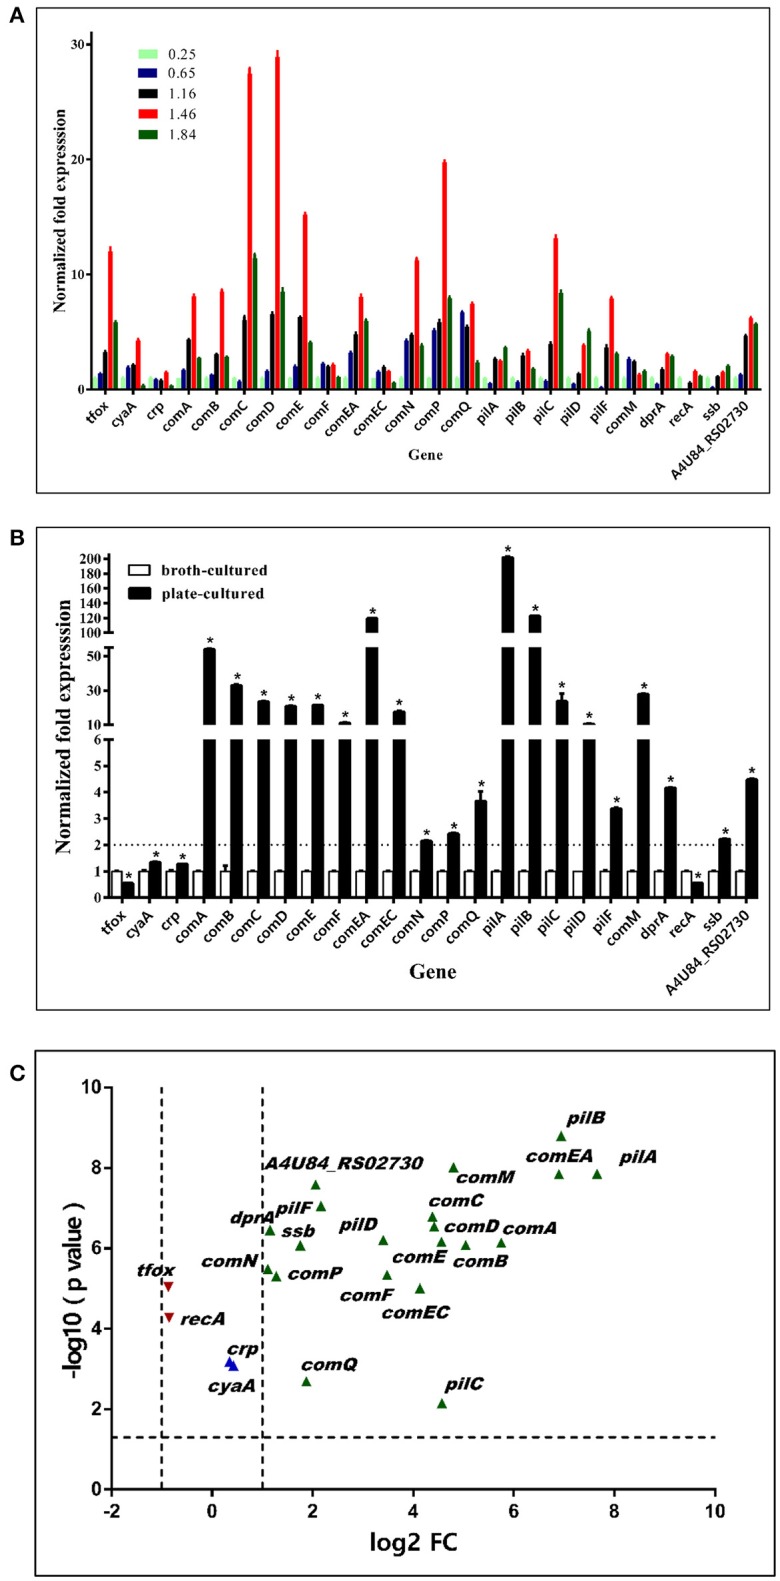
Figure 8.

Expression levels of competence genes of bacteria cultured in TSB++ and on TSA++. (A) qRT-PCR analysis of mRNA levels of candidate competence genes in H. parasuis SC1401in different growth phase measured by optical density at 600 nm. (B) qRT-PCR analysis of mRNA levels of H. parasuis SC1401 cultured in TSB++ and on TSA++. (C) Volcano plot of gene express levels of bacteria cultured on TSA++ compared to that in TSB++. Horizontal dotted line indicates significance test result and vertical dotted lines indicate fold changes. The data represent means standard errors (n = 3), and error bars indicate standard deviations. Asterisks indicate statistical significance using one-way ANOVA (*P < 0.05).
