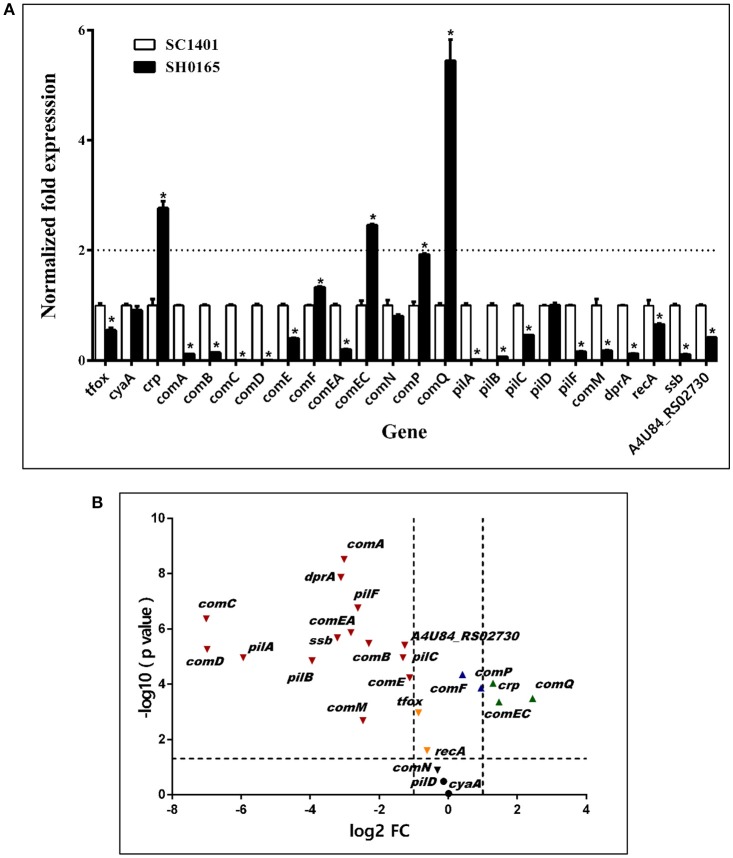
Figure 9.
Expression levels of competence genes of H. parasuis SC1401 and SH0165 (A) qRT-PCR analysis of mRNA levels of H. parasuis SH0165 and SC1401. (B) Volcano plot of gene express levels of H. parasuis SH0165 compared to those of SC1401. Horizontal dotted line indicates significance test results and vertical dotted line indicates fold changes. The data represent means standard errors (n = 3), and error bars indicate standard deviations. Asterisks indicate statistical significance using one-way ANOVA (*P < 0.05).

