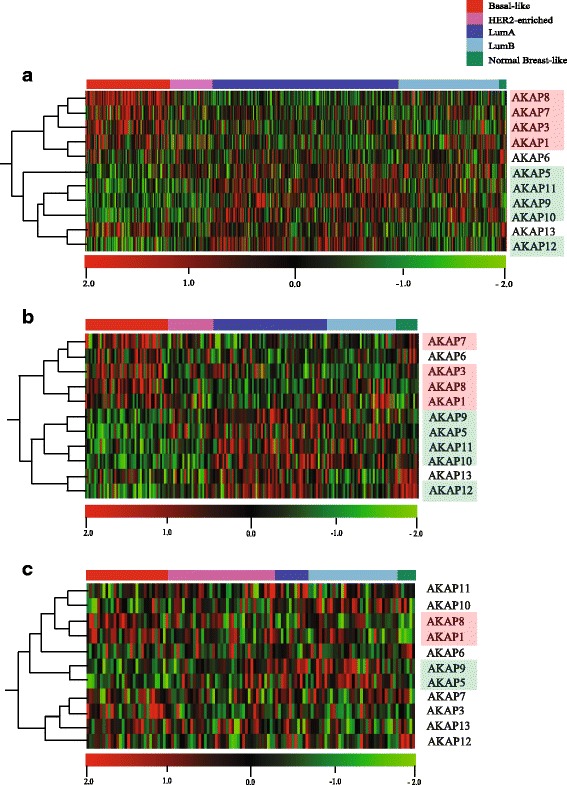
Fig. 3.

Expression profiles of the AKAP gene family in three different cohorts, tumors ordered by PAM50 subtype, genes are orderad by hierarchial clustering. a TCGA RNAseq expression profiles from primary tumors (n = 522). Genes are ordered by hierarchical clustering p < 0.0001 by ANOVA; q < 0.000072. Intrinsic subtype calls for the TCGA data were taken from the original manuscript [1]. b Risk Cohort microarray expression profiles from primary breast cancer tumors (n = 182). c Cohort 1 microarray expression profiles from metastatic lesions (n = 120)
