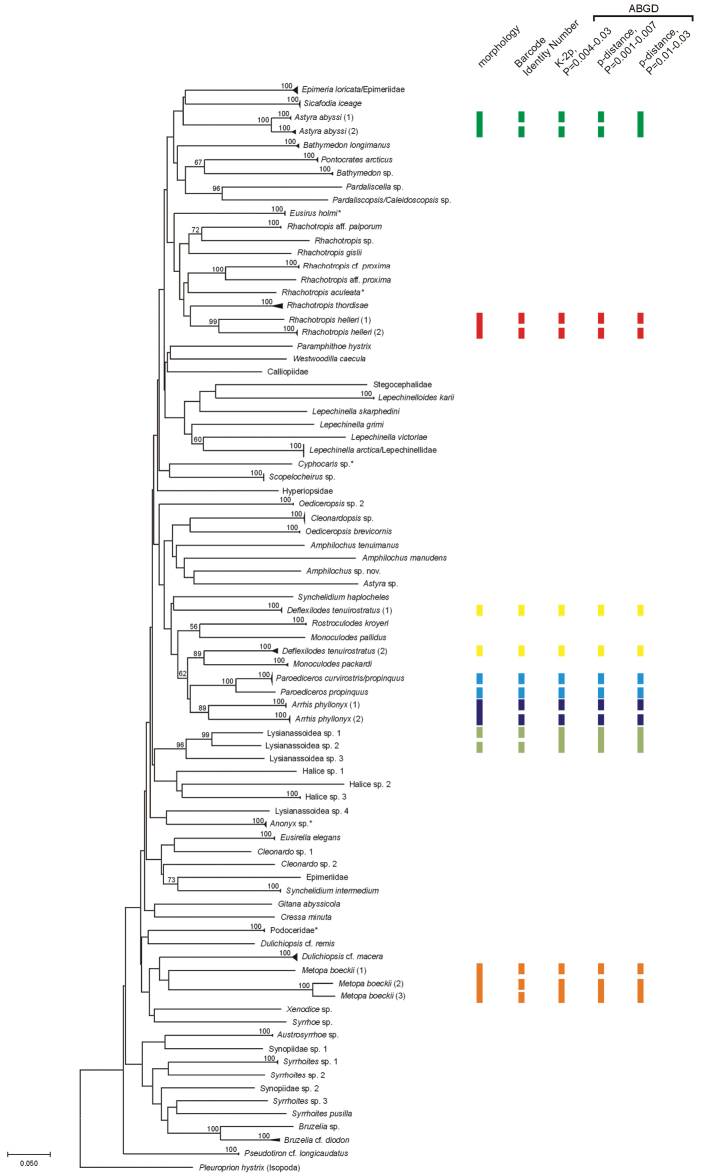
Figure 2.
Neighbour-joining (NJ) tree of COI sequences (Suppl. material 1) based on Kimura 2-parameter. Triangles indicate the relative number of individuals studied (height) and sequence divergence (width). The asterisk (*) symbolizes taxa having already published sequences in BOLD/GenBank identified to species level. The numbers in front of the nodes indicate bootstrap support (1000 replicates, only values higher than 50% are presented). The vertical bars represent species delimitations taxonomies obtained from morphology and different species delimitation methods. The same colour indicates the same nominal species. Only the cases where incongruence between different delimitation methods were observed are shown. Note that this tree is not the reconstruction of evolutionary history of presented taxa.

