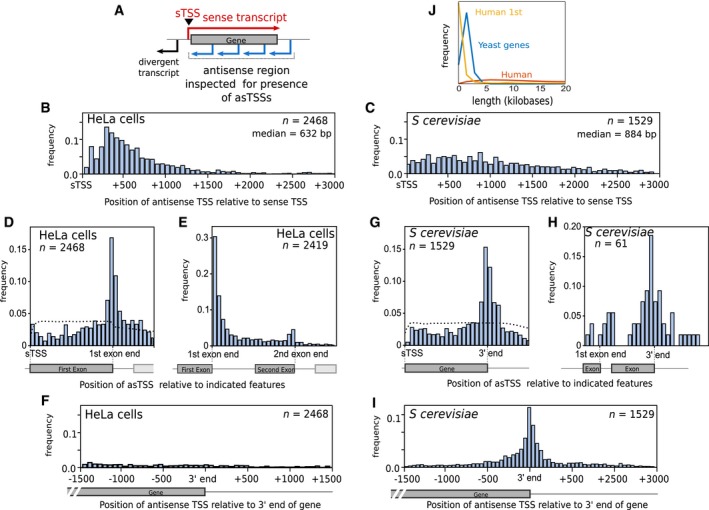
A schematic demonstrating how antisense TSSs (asTSSs) were defined in this study. Blue arrows represent possible sites of antisense transcript initiation, within the region inspected for the presence of asTSSs, as defined by CAGE.
The distribution of distances between sTSS and asTSS in HeLa cells, for those 2,468 genes which had both an upstream sTSS and an internal asTSS defined by CAGE. Shown is the median distance between the sTSS and asTSS.
The distribution of distances between the sTSS and asTSS in Saccharomyces cerevisiae (budding yeast), for those 1,529 genes that had both an overlapping sense and antisense transcript, defined by TIF‐seq.
The position of the asTSS relative to the sTSS and the end of the 1st exon in HeLa cells, to demonstrate which of the two points the asTSS aligns to preferentially. This position was defined as the distance between the sTSS and the asTSS, divided by the distance between the sTSS and the end of the 1st exon. The genes are the same as those shown in (B). The dotted line represents the average distribution from a thousand simulations, in which asTSSs for each gene were randomly reassigned to a base pair within the region shown.
The position of the asTSS relative to the end of the 1st exon and the end of the 2nd exon, for those HeLa genes in (D) that also had a second exon.
The distribution of distances between the 3′ end of genes and asTSS in HeLa cells, for the same genes in (B).
The position of the asTSS relative to the sTSS and the 3′ end of the open reading frame of the 1,529 S. cerevisiae genes that have both an overlapping sense and antisense transcript. The dotted line was generated as in (D).
The position of the asTSS relative to the end of the 1st exon and the 3′ end of the open reading frame of those S. cerevisiae genes in (G) that also have an intron.
The distribution of distances between the 3′ end of S. cerevisiae genes and asTSS in, for the same genes in (C).
The distribution of lengths for human 1st exons, human genes, and yeast genes.

