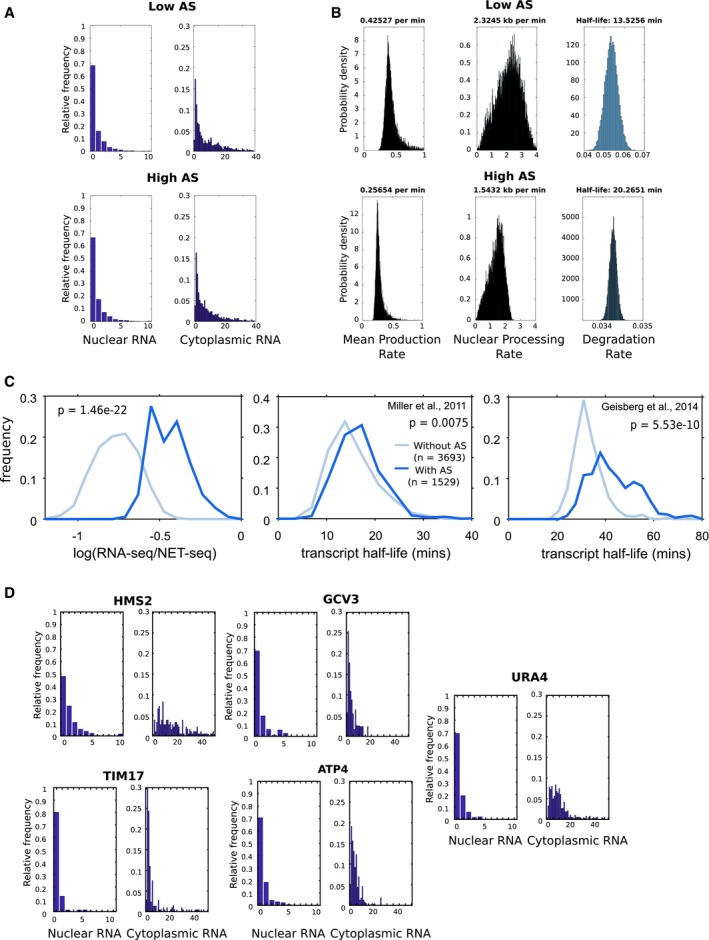
Figure EV3. Nuclear and cytoplasmic RNA‐FISH distributions for GAL1 foci and dynamics of transcription and transcript processing.

- The distribution of RNA foci in the nucleus or cytoplasm from WT with high or low antisense transcription, as indicated.
- Plots showing the probability density for mean production rate (left panel), nuclear processing rate (middle panel) and degradation rate (right panel) for WT strains with high or low antisense transcription, as indicated. The most likely rate is indicated above each plot.
- Estimates of transcript stability for sense transcripts from 1,529 genes with an asTSS (dark blue) or 3,693 genes without one (light blue). Left panel, ratio of sense RNA‐seq over sense NET‐seq as an estimate of transcript stability, middle and right panels transcript stability using data sets indicted. The frequency plots show that the majority of transcripts have higher stability when expressed from genes with an antisense transcript.
- The distribution of RNA foci in the nucleus or cytoplasm for GFP‐tagged loci as indicated.
