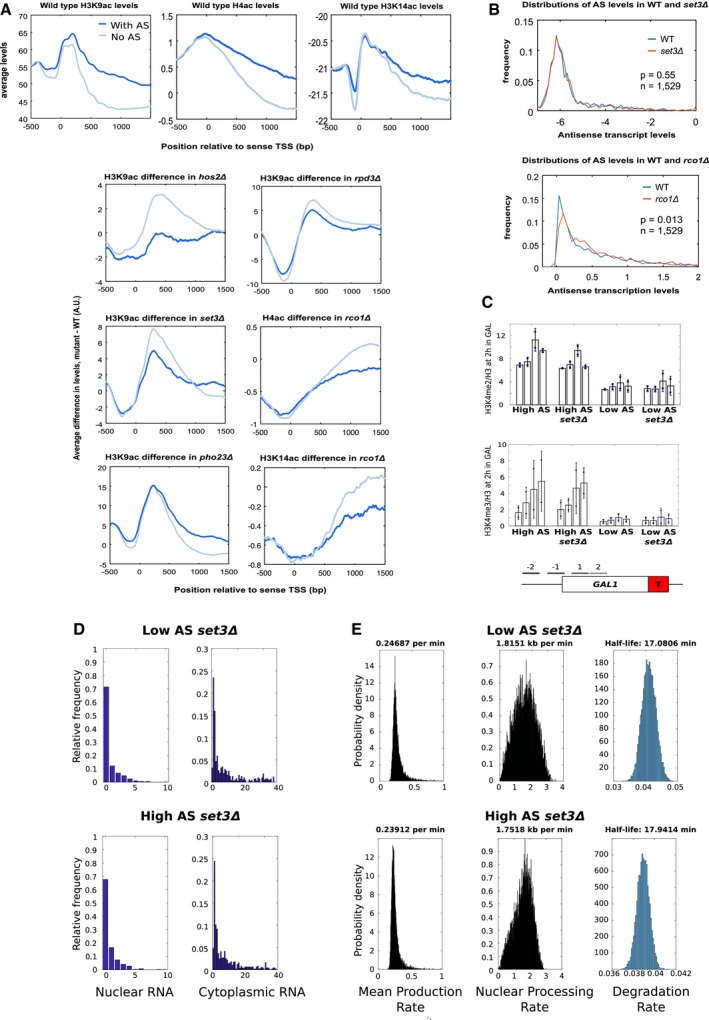
Figure EV4. The presence of an antisense transcript can alter how histone acetylation levels change following deletion of a histone modifying enzyme.

-
AAverage levels of H3K9, K14 and H4 acetylation in all budding yeast genes for both genes with and without an asTSS (top panels) or average difference in H3K9, K14 or H4 acetylation between mutant strains and wild type for both genes with and without an asTSS (bottom panels).
-
BAverage antisense transcript levels do not change upon SET3 deletion. Distribution of transcript levels in WT and set3Δ strains, obtained from Kim et al (2012); and transcription levels in WT and rco1Δ strains, obtained from Churchman and Weissman (2011), for those 1,529 antisense transcripts considered in this study. In contrast to the rco1Δ, there is no significant change in the genome‐wide levels of these antisense transcripts, suggesting there is no overall increase or decrease in antisense transcription upon SET3 deletion.
-
CH3K4me2/3 does not change upon SET3 deletion. Levels of H3K4me2 and H3K4me3 relative to histone H3 at the engineered GAL1 gene containing the altered ADH1 terminator (T) as measured by ChIP‐qPCR at the primer positions indicated in the schematic below in the strains with high and low antisense in the presence and absence of SET3. N = 2, error bars are SEM.
-
D, ENuclear and cytoplasmic RNA‐FISH distributions for GAL1 foci and dynamics of transcription and transcript processing. (D) The distribution of foci in the nucleus or cytoplasm from set3Δ with high or low antisense transcription, as indicated. (E) Plots showing the probability density for mean production rate (left panel), elongation/export rate (middle panel) and degradation rate (right panel) for set3Δ strains with high or low antisense transcription, as indicated. The most likely rate is indicated above each plot.
