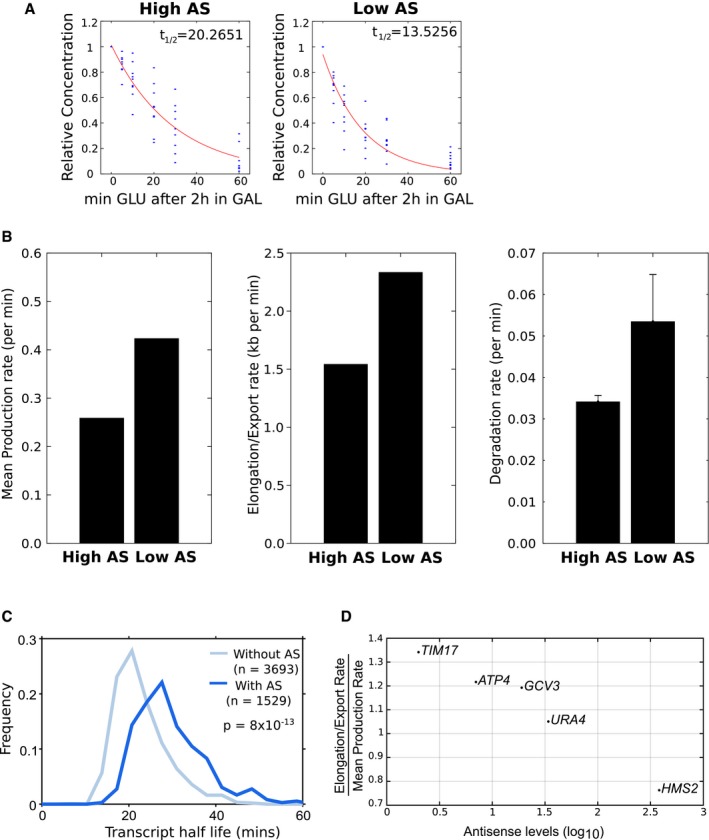
Figure 5. Transcription dynamics change with high antisense transcription.

- GAL1 sense transcript turnover rates from the engineered GAL1 with high (left) or low (right) antisense transcription. The red lines show the best fit for nine experiments (see Fig 4E for details).
- Histograms showing the mean production rate (left), mean elongation/export rate (middle) and transcript degradation rate (right; error bars for degradation rates are RMSE of linear regression fit to exponential model) for the engineered GAL1 genes expressing high or low antisense transcription.
- Transcript stability for sense transcripts from 1,529 genes with an asTSS (dark blue) or 3,693 genes without one (light blue). The frequency plot shows the majority of transcripts have higher stability when expressed from genes with an antisense transcript.
- Elongation/export rate expressed relative to mean production rate for five endogenous genes ranked by levels of corresponding levels of antisense transcription in a 300 bp downstream of the antisense TSS as determined by NET‐seq.
