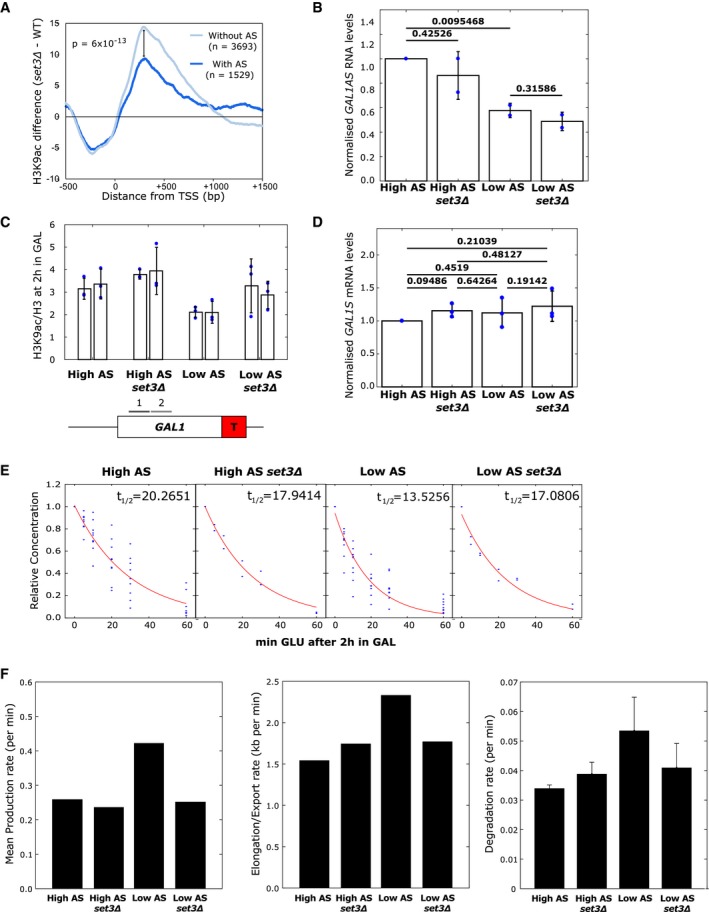
Strains lacking SET3 show a larger increase in H3K9ac, relative to WT levels, at 3,693 genes without antisense transcripts compared to 1,529 genes with antisense transcripts.
Quantitation of GAL1 antisense transcript levels from the high and low antisense constructs with or without SET3. N = 2, data points shown, error bars are SD, P‐values are shown above the bars calculated by paired t‐test.
Chromatin immunoprecipitation showing levels of H3K9ac relative to histone H3 in the strains with high or low antisense transcription in the presence or absence of SET3. The positions of the primer pairs for RT–qPCR are shown in the schematic below. N = 3, data points shown, error bars are SEM.
Quantitation of GAL1 sense transcripts from Northern blotting of the high and low antisense constructs with or without SET3. N = 3 error bars are SD, P‐values are shown above the bars calculated by paired t‐test.
GAL1 sense transcript degradation rates in SET3 (N = 9) and set3Δ (N = 2) strains with high or low GAL1 antisense transcripts.
Histograms showing the mean production rate (left), mean elongation/export rate (middle) and transcript degradation rate (right) for the engineered GAL1 genes expressing high or low antisense transcription in the presence or absence of SET3. Error bars for degradation rates are RMSE of linear regression fit to exponential model.

