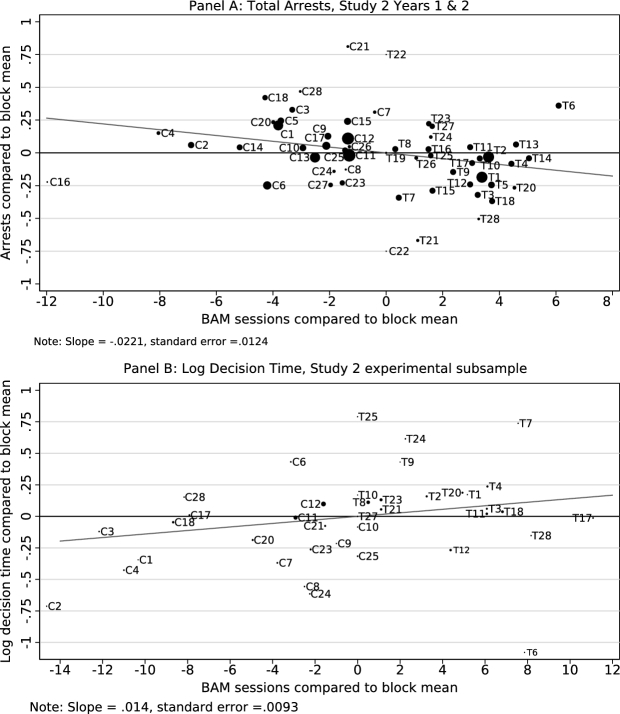
Figure II.
Treatment Effect on Arrests and Automaticity (Decision-Making Time) Study 2
Points in the graph are treatment and control group means for each randomization block, after subtracting off block mean (see Kling, Liebman, and Katz 2007). Line in each graph is the partial regression plot fitted from an IV model that uses the interaction of treatment and randomization blocks as instruments for number of BAM sessions attended. The size of each point is proportional to the number of observations in that cell.

