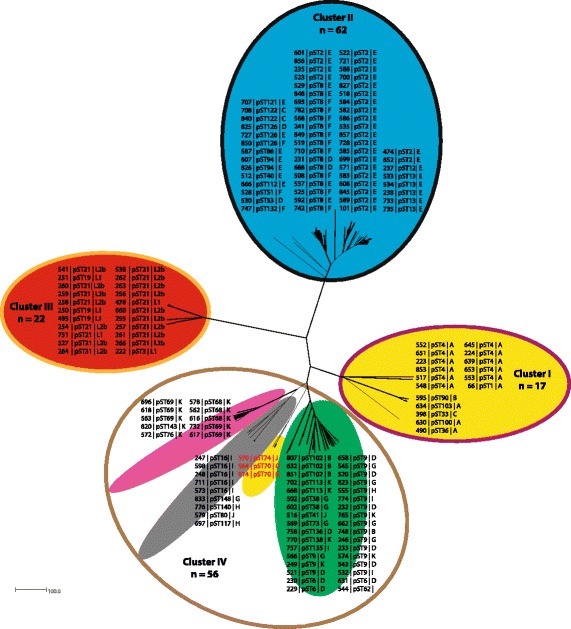
Fig. 3.

NeighborNet tree showing the comparison between core genome and plasmid clustering of 157 Chlamydia trachomatis isolates. Coloured halos indicate the distinct clusters from Fig. 1, isolates are indicated by the Chlamydiales pubMLST ID numbers, plasmid sequence type (pST) and ompA genovar. Isolates shown in red indicate potential plasmid exchanges compared to the plasmid clusters in Fig. 2
