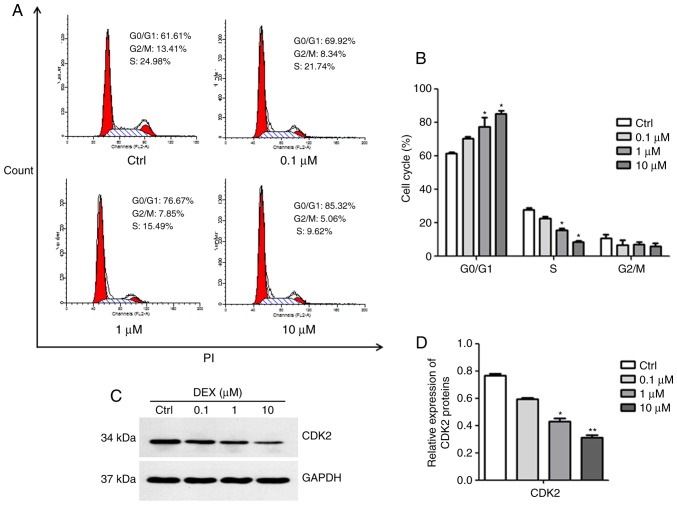
Figure 2.
DEX induces G0/G1 phase arrest in MC3T3-E1 cells. (A) Cell cycle analysis using flow cytometry following PI staining and (B) quantification of the cell cycle populations demonstrated that the proportion of cells in G0/G1 phase increased in the DEX treatment group compared with that in the control. (C) The expression of CDK2 was assessed by western blot analysis. (D) A relative quantification assay was performed to assess the expression of CDK2 normalized to the GAPDH expression. Values are expressed as the mean ± standard deviation (n=3). *P<0.05 and **P<0.01 vs. Ctrl. Ctrl, control; CDK, cyclin D kinase; DEX, dexamethasone; PI, propidium iodide.

