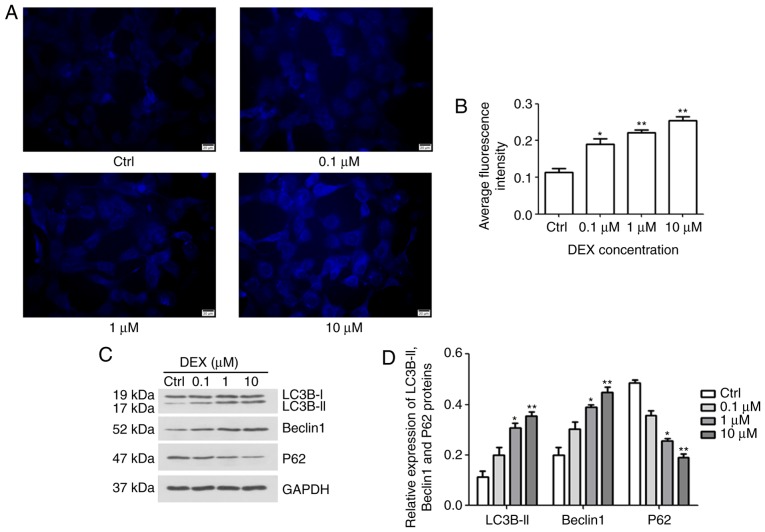
Figure 3.
Fluorescence intensity of autophagic vacuoles in MC3T3-E1 cells under fluorescence microscopy. (A) The intensity of autophagic vacuoles was evaluated by MDC staining (magnification, ×400; scale bar, 20 μm) and (B) their average fluorescence intensity was quantified. It was indicated that DEX increased the number of autophagic vacuoles. (C) Western blot analysis was performed to determine the protein expression levels of autophagy-associated proteins Beclin1, LC3B and P62. (D) The relative expression of LC3B-II, Beclin1 and P62 were calculated. Values are expressed as the mean ± standard deviation (n=3). *P<0.05 and **P<0.01 vs. Ctrl. Ctrl, control; DEX, dexamethasone; LC3B, microtubule-associated proteins 1A/1B light chain.

