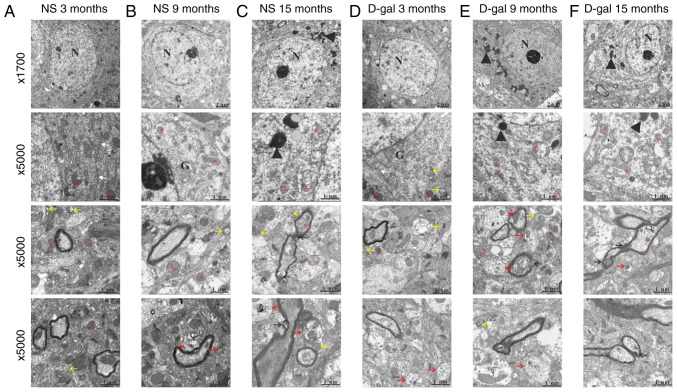
Figure 2.
Ultrastructural morphology changes with aging in the NS and D-gal groups. Transmission electron microscopy demonstrated ultrastructural changes in the auditory cortex of the NS and D-gal groups at different ages. Transmission electron microscopy images of the NS groups at (A) 3, (B) 9 and (C) 15 months, and the D-gal groups at (D) 3, (E) 9 and (F) 15 months. The red asterisks indicate the mitochondria; the black arrows indicate the disrupted myelin; the yellow arrows indicate the autophagosomes; the red arrows indicate the auto-lysosomes; the white arrows indicate the endoplasmic reticulum; and the black arrowheads indicate the lipofuscin. Scale bar, 2 mm at magnification, ×1,700 and 1 mm at magnification, ×5,000. Sections were stained with uranyl acetate and lead citrate. N, nucleus; G, Golgi apparatus; NS, normal saline; D-gal, D-galactose.

