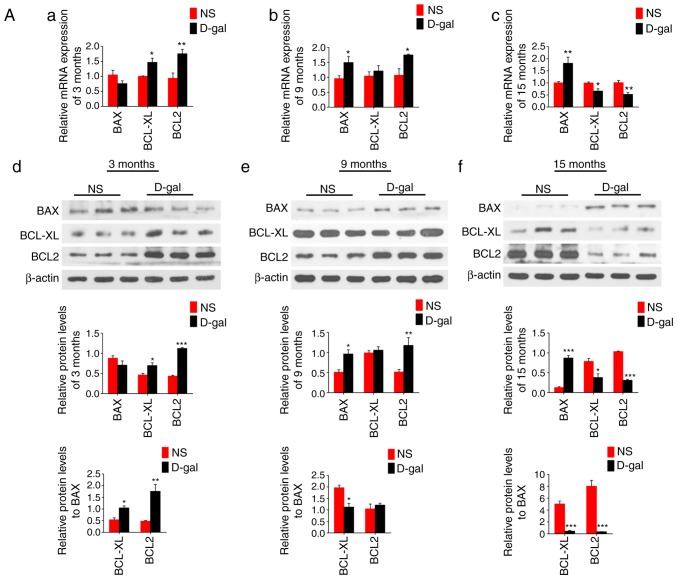
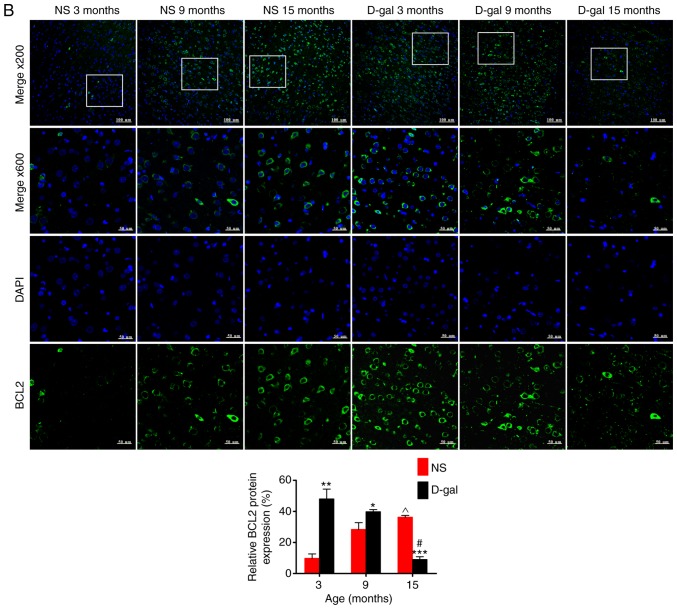
Figure 7.
mRNA and protein expression levels of BCL2, BCL-xL and BAX in the NS natural aging group and D-gal-induced mimetic aging group. (Aa-c) Reverse transcription-quantitative polymerase chain reaction and (Ad-f) western blotting were used to study the mRNA and protein expression levels in the D-gal group and NS group, respectively. β-actin was used as a loading control. (B) Visualization of changes of BCL2 protein expression with aging was demonstrated using immunofluorescence, and the nuclei were stained with DAPI. Data are expressed as mean ± standard error of the mean. *P<0.05, **P<0.01 and ***P<0.001 vs. the age-matched NS subgroup; ^P<0.01 vs. the 3-month-old NS subgroup; #P<0.001 vs. the 3-month-old D-gal subgroup. Scale bar, 100 mm at magnification, ×200 and 50 mm at magnification, ×600. NS, normal saline; D-gal, D-galactose; BCL2, B-cell lymphoma 2; BCL-xL, B-cell lymphoma-extra large; BAX, B-cell lymphoma 2-associated X protein.


